
Figure 2. Statistical summary of changes from baseline for fetal cardiovascular responses to 1 h of hypoxaemia occurring during infusions.
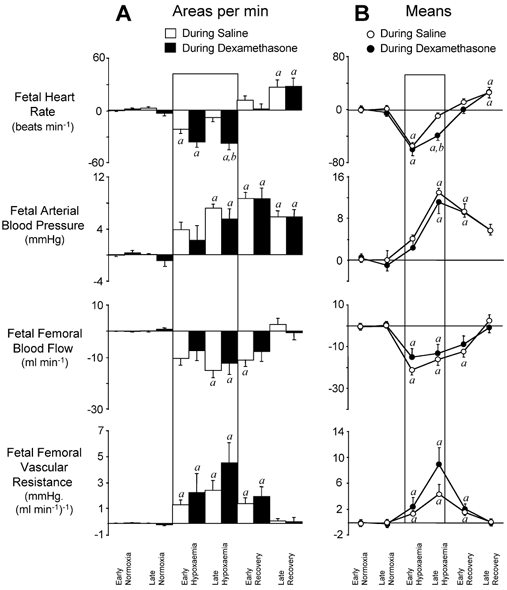
A, mean ±s.e.m. of the areas bounded by the curve for each variable, expressed per minute. B, line graphs representing mean ±s.e.m. of values for changes from individual baselines in fetal heart rate, arterial blood pressure, femoral blood flow and femoral vascular resistance during the following time periods: early (0–45 min) and late (46–60 min) normoxia, early (61–75 min) and late (76–120 min) hypoxaemia, and early (121–135 min) and late (136–180 min) recovery. Fetal cardiovascular responses during saline infusion (○; n = 7) and during dexamethasone treatment (•; n = 7) are represented by open and filled bars, respectively, in A. Significant differences (P < 0.05): a, differences by post hoc analysis indicating a significant main effect of time compared with normoxia; b, differences by post hoc analysis indicating a significant main effect of dexamethasone treatment compared with saline infusion (two-way repeated-measures ANOVA + Tukey test).