
Figure 7. Effect of blockage of locally activated inhibition on the antidromically activated burst.
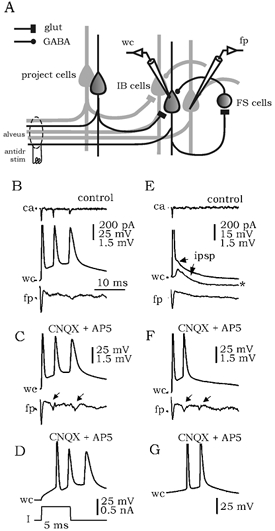
A, schematic of the local excitatory and inhibitory circuits mediating antidromic responses in the subiculum. Antidromic stimulation (antidr stim) of the alveus activates a subpopulation of projection cells (project cells), which in turn excites other projection cells and GABAergic interneurons. If most bursting cells (IB cells) were inhibited by locally activated GABAergic interneurons (FS cells), then antidromically activated bursting should be visible in the field potential (fp) on removal of this inhibition by blockers of glutamatergic transmission (glut). B, antidromic activation of some bursting cells elicited intrinsic bursts in control conditions in cell-attached (ca) and whole-cell configurations (wc). These bursts were not recorded in the field potential (fp). C, blockage of local activation of inhibition by CNQX and AP5 resulted in bursts in the field potential (arrows) suggesting that most bursting cells were inhibited. D, intrinsic burst elicited by depolarizing current pulses. Recordings shown in B-D are from the same cell. E, the effect of local inhibition on antidromically activated bursts was evident in some cells. These bursts were prevented by locally activated IPSPs. See the EPSP/IPSP sequence in the subthreshold curve (*). F, blockage of local activation of inhibition released bursting in both wc and fp recordings (arrows in the fp trace). G, intrinsic burst elicited by depolarizing current pulses. Recordings shown in E-G are from the same cell.