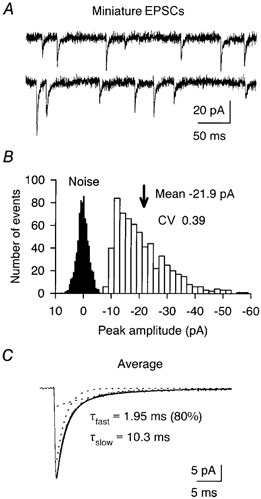
Figure 3. Climbing fibre MEPSCs in an immature Purkinje cell.

A, examples of MEPSCs recorded from a P3 Purkinje cell in the presence of 5 mm Ca2+ and 0.3 μm TTX. Vh, −70 mV. B, amplitude histogram of 636 MEPSCs recorded from the cell in A. Noise histogram is scaled for clarity. CV of MEPSC amplitude was calculated after subtracting the noise variance. C, averaged waveform of MEPSCs fitted with a double-exponential function (superimposed continuous line). Dotted lines indicate fast and slow components.
