
Figure 4. Stability analysis of CF EPSCs.
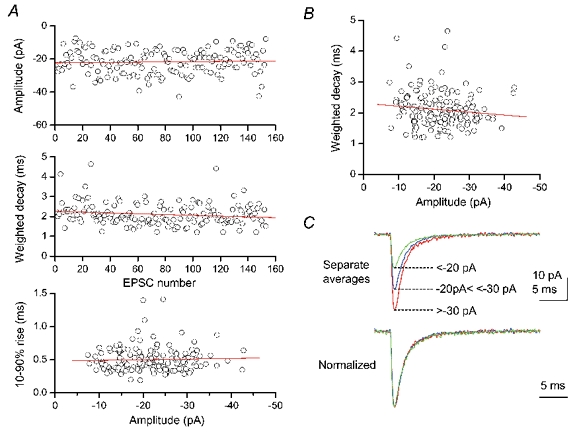
Analysis of spontaneous EPSCs recorded from a P3 Purkinje cell. Vh, −70 mV. External Ca2+, 5 mm. A, stability plots of amplitude (top) and weighted decay time (middle), and plot of 10–90 % rise time against the amplitude (bottom) of 153 consecutive EPSCs. Straight lines indicate linear regression. The lack of correlation between plotted parameters was confirmed by Spearman's rank test. B, the amplitudes and decay times of EPSCs were not correlated. C, EPSCs were averaged separately according to peak amplitude grouped into three ranges (top). The three separate averages were normalized and superimposed, to illustrate the lack of correlation between decay time course and amplitude (bottom).