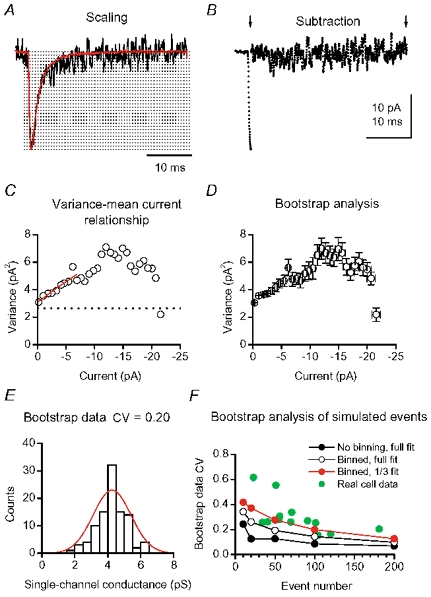
Figure 5. Peak-scaled non-stationary fluctuation analysis of CF EPSCs.

Procedures of PS-NSFA, applied to 153 spontaneous EPSCs analysed in Fig. 3. A, averaged waveform (red trace) scaled at the peak of an individual EPSC (black trace). Dotted lines indicate binning to 30 fractions. B, subtraction of the peak-scaled average from the individual EPSC shown in A. Arrows indicate the range in which the subtraction was applied. For clarity, data are represented as points. The sum-squared difference was calculated for each bin. The procedure was repeated for each EPSC and cumulated averages are plotted in C. C, the straight red line indicates the fit of the initial one-third of the plot to the theoretical equation (see Methods). The dotted line indicates the baseline variance (2.6 pA2). The weighted mean synaptic channel conductance was 4.6 pS. D, PS-NSFA on randomly re-sampled events was repeated 100 times. Means and s.d.s of the 100 current-variance plots are shown. The individual plot was fitted as in C. E, estimates of the channel conductance obtained by fitting bootstrapped data displayed a normal distribution (red curve). F, relationship of the bootstrap data CV versus the number of events, on simulated current (line-connected symbols) and the real EPSCs (green, pooled data in 5 and 2 mm Ca2+). The bootstrap data CV were also affected by the binning and fitting conditions.
