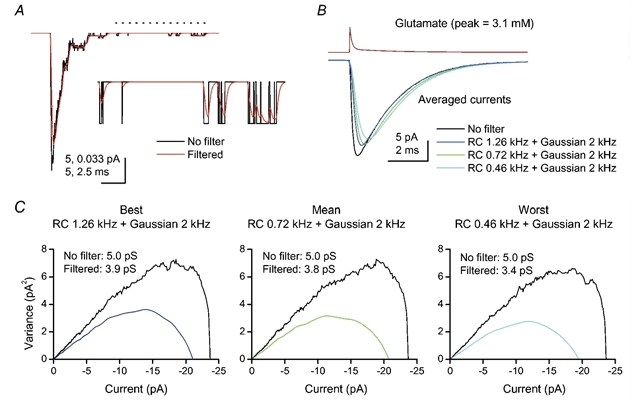
Figure 7. Effects of filtering on the quantal size and single-channel conductance estimated from PS-NSFA.

A, example of a simulated EPSC, in the absence (black) and presence (red) of an RC filter (0.72 kHz) cascaded with a Gaussian filter (2 kHz). The single-channel conductance was 5 pS, the number of channels was 100, and the driving force was −100 mV. The glutamate pulse was set to rise instantaneously to the peak concentration (3.1 mm) and decay as a double-exponential waveform (Clements, 1996), as shown in B. Inset, expansion of the indicated part (dotted line) of currents. B, averaged currents of simulated EPSCs (1000 events averaged in each condition). C, current-variance plots of simulated EPSCs obtained by PS-NSFA. Each plot is derived from 1000 events simulated as in A and B. The initial one-third of the plot was fitted to the theoretical equation (Methods).
