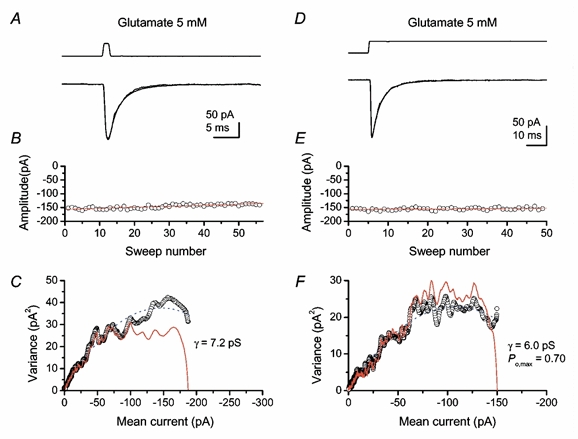
Figure 8. Non-stationary fluctuation analysis of AMPAR-mediated currents in outside-out patches activated by rapid application of glutamate.

Data derived from the same patch excised from P4 Purkinje cell. A and D, current-response activated by short (1 ms) or long (100 ms) pulses of glutamate (5 mm). Averaged response and an individual response are superimposed. Top traces indicate the timing of solution exchange measured as changes in liquid junction currents. B and E, stability of peak amplitude of glutamate-activated currents was confirmed by Spearman's rank test. Red lines, linear regression. C and F, open circles are current-variance plots by Sigworth-type NSFA applied to the glutamate-activated currents of extrasynaptic non-NMDARs. The blue dotted lines indicate the fit to the theoretical Sigworth equation (Methods). The red lines in C and F show the current-variance relationship by PS-NSFA. Channel open probability at the peak of the current was 0.57 for the short pulse.
