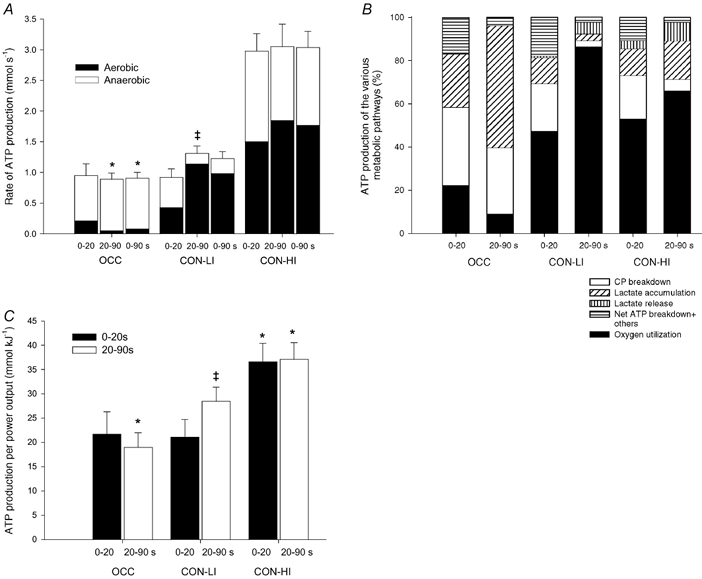
Figure 6. Rate of ATP production (A), relative contribution of the various energetic pathways (B) and ATP production per unit of work (C).

Results are shown from 0–20, 20–90 s and during the entire period of 90 s of low intensity knee-extensor exercise with (OCC) and without thigh occlusion (CON-LI) as well as 90 s of high intensity exercise preceded by low intensity exercise (CON-HI). Means ±s.e.m. are given. *Significantly (P < 0.05) different from CON-LI. †Significant difference between the first 20 and next 70 s of exercise.
