
Figure 1. Schematic representation of the extracellular catabolism of ATP and adenosine.
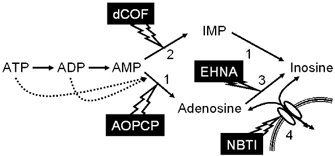
The solid arrows indicate the enzymatic activities identified. Dotted arrows represent inhibition of the ecto-5′-nucleotidase activity by ATP and ADP. The numbers in the figure represent: 1, ecto-5′-nucleotidase; 2, ecto-AMP deaminase; 3, ecto-adenosine deaminase; 4, adenosine transporter. The lightning-like arrows indicate the enzymatic activities that are the main targets of the indicated drugs (AOPCP, α,β-methylene ADP; dCOF, deoxycoformycin; ENHA, erythro-9-(2-hydroxy-3-nonyl)adenine; NBTI, S-(p-nitrobenzyl)-6-thioinosine). Note that dCOF also inhibits adenosine deaminase as well as adenosine transporters, EHNA inhibits adenosine deaminase, and AOPCP inhibits both the dephosphorylation of AMP as well as that of IMP.