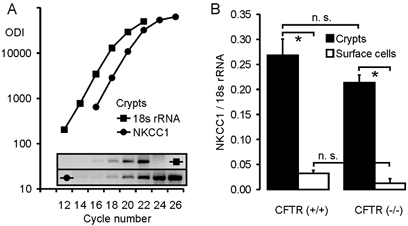
Figure 2. Method of the semiquantitative RT-PCR (A) and expression analysis of NKCC1 in colonic crypts and surface cells from CFTR (+/+) and CFTR (−/−) mice (B).

A, determination of NKCC1 expression in colonic crypts from CFTR (+/+) mice, using 18 s rRNA as an internal control. Amplification curves were created for both the NKCC1 and 18 s rRNA primer pairs, and the virtual relationship optical density integrated (ODI) of the studied gene vs. the ODI of 18 s rRNA was used as a measure for the expression level of the gene of interest after correction of the values for the different PCR products according to their length. B, relative expression levels of NKCC1 in colonic crypts (▪) and surface cells (□) from CFTR (+/+) (left panel) and CFTR (−/−) mice (right panel). NKCC1 was significantly more abundant in crypts than in surface cells (P < 0.01, Student's unpaired t test); the expression levels in CFTR (−/−) tissues were slightly, but not significantly reduced (n = 4–6 mice).
