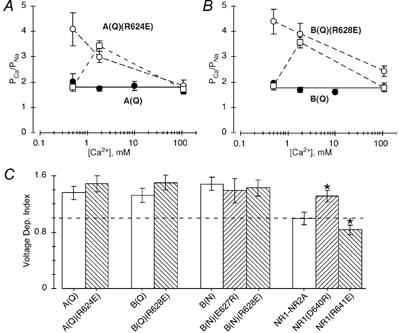
Figure 6. Concentration and voltage dependence of Ca2+ permeability in channels containing opposite charge substitutions.

A, average PCa/PNa derived from changes in the reversal potential for various Ca2+ concentrations in cells expressing GluR-A(Q) (•) or A(Q)(R624E) (○) subunits. The continuous line reflects the average PCa/PNa (1.6) in wild type GluR-A(Q) over a concentration range of 0.5 to 110 mm Ca2+. The dashed lines have no theoretical meaning. PCa/PNa for NMDAR NR1-NR2A channels normalized to the value at 110 mm Ca2+ in wild type GluR-A(Q) channels are shown by □. The NMDAR values are from Jatzke et al. (2002) with the actual PCa/PNa values being about 3.8, 7.2 and 3.6, when measured in 0.5, 1.8 or 110 mm Ca2+, respectively. A minimum of four recordings was made at each concentration. B, as in A except subunits are GluR-B(Q) (•) and -B(Q)(R628E) (○). C, voltage dependence of Ca2+ permeability, (PCa/PNa)−20 mV/(PCa/PNa)−60 mV, for various wild type and mutant GluR subunit combinations. PCa/PNa was derived from Pf values measured either at −20 or −60 mV (Table 2). The dashed line (= 1) corresponds to a channel where PCa/PNa shows no voltage dependence. * Values that are significantly different from those for their respective wild type channel.
