
Figure 2. Effects of pre-incubation glucose concentration on glycogen content and latency to CAP failure during aglycaemia.
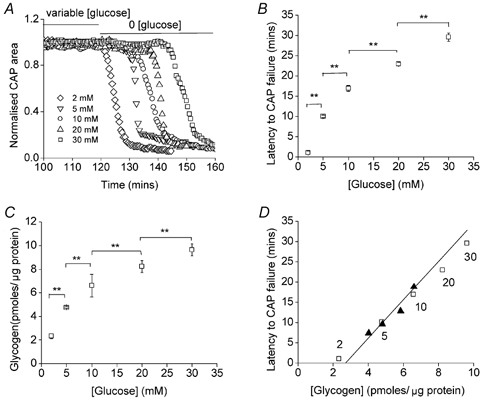
A and B, nerves bathed for 2 h in 2, 5, 10, 20 or 30 mm glucose had latencies to CAP failure of 1.0 ± 0.5 min (n = 3), 10.1 ± 0.3 min (n = 3; P < 0.001vs. 2 mm), 16.9 ± 0.8 min (n = 3; P < 0.001vs. 5 mm), 23.0 ± 0.5 min (n = 3; P < 0.001vs. 10 mm) and 29.6 ± 1.1 min (n = 3; P < 0.001vs. 20 mm), respectively (** indicates P < 0.001); ANOVA with Tukey's post hoc test. C, nerves bathed for 2 h in 2, 5, 10, 20 or 30 mm glucose had glycogen content of 2.34 ± 0.25 pmol glycogen (μg protein)−1 (n = 3), 4.77 ± 0.10 pmol glycogen (μg protein)−1 (n = 3; P < 0.001vs. 2 mm), 6.57 ± 0.23 pmol glycogen (μg protein)−1 (n = 3; P < 0.001vs. 5 mm), 8.23 ± 0.49 pmol glycogen (μg protein)−1 (n = 3; P < 0.001vs. 10 mm) and 9.63 ± 0.50 pmol glycogen (μg protein)−1 (n = 3; P < 0.001vs. 20 mm), respectively (** indicates P < 0.001); ANOVA with Tukey's post hoc test. D, straight line shows calculated relationship between the latency to onset of CAP failure during aglycaemia and glycogen content (see text for details). Open squares indicate actual data points from B and C, and numbers by the squares indicate pre-incubation glucose concentrations. Filled triangles indicate the data from Fig. 7B and C (see text). Error bars in B and C indicate the s.e.m.