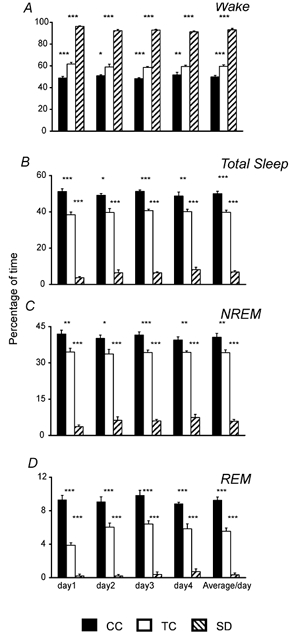
Figure 1. Effects of sleep deprivation on the sleep-wake cycle.

The graphs show the percentage of time spent in the different stages of the sleep-wake cycle (A, B, C and D represent waking, total sleep, NREM and REM sleep, respectively) in cage control (CC), treadmill control (TC) and sleep-deprived (SD) animals during each day of recording and the average for 96 h. Data are means ±s.e.m. for groups of 6 rats each. ***P < 0.001, **P < 0.01 and *P < 0.05. Comparisons between CC and SD were also significant (P < 0.001) in all cases. One-way ANOVA, followed by Tukey post hoc test.
