Abstract
The retinal pigment epithelium (RPE) regulates the ionic composition of the fluid surrounding the photoreceptors by transport mechanisms that utilize Cl− channels. Cl− currents in RPE cells, however, remain incompletely characterized. The purpose of this study was to identify the Cl− currents in acutely isolated Xenopus RPE cells using whole-cell patch clamp. We describe three different Cl− currents. (1) An inwardly rectifying Cl− current, ICl,ir, activates slowly with hyperpolarization (τact=μ1 s at −80 mV, V1/2=−94 ± 3 mV), is blocked by Zn2+ (IC50=185 μm), is stimulated by acid (ICl,ir is 5 times larger at pH 6 than pH 8), and is blocked by DIDS in a voltage-dependent manner. ICl,ir closely resembles cloned ClC-2currents. (2) An outwardly rectifying Cl− current, ICl,Ca, is stimulated by elevated cytosolic free [Ca2+]. With 1 μm free [Ca2+]i in the patch pipette, ICl,Ca activates slowly with depolarization (τact=325 ms at 100 mV) and deactivates upon hyperpolarization. ICl,Ca is not blocked by 1 mm Zn2+ or 10 μm Gd3+ but is blocked by DIDS. High extracellular [Ca2+] (10 mm) also activates ICl,Ca. (3) A non-rectifying current is activated by elevation of cytoplasmic cAMP with forskolin and IBMX. In addition to these three Cl− currents, Xenopus RPE cells exhibit a non-selective background current (Ibkg) which has a linear I-V relationship and is voltage insensitive. This current is blocked by Zn2+ (IC50 of 5.3 μm) or 10 μm Gd3+. This description provides new insights into the physiology of Cl− channels involved in salt and fluid transport by the retinal pigment epithelium.
Recently, it has become apparent that Cl− channels play fundamental roles in the health and well-being of the retina. Knockout of the chloride channel genes ClC-2, ClC-3, or ClC-7 in mice results in postnatal degeneration of the retina (Bosl et al. 2001; Kornak et al. 2001; Stobrawa et al. 2001). In these ClC knockout mice, the retina develops normally, but begins to degenerate 1 to 2 weeks postnatally. The mechanisms underlying retinal degeneration may involve membrane trafficking defects, at least in the case of ClC-3 and ClC-7, which are known to be located on intracellular vesicles. Bestrophins are another family of Cl− channels that are linked to retinal degeneration (Sun et al. 2002). The founding member of the bestrophin family was positionally cloned from a family with an inherited form of early-onset macular degeneration known as Best macular dystrophy (Petrukhin et al. 1998). In this disease, a yellow pigment, probably lipofuscin, accumulates between the photoreceptors and retinal pigment epithelium and ultimately leads to degeneration of photoreceptors in the macula (Gass, 1987; O'Gorman et al. 1988).
In both mice with ClC-2 knockout and humans with Best macular dystrophy, there is reason to believe that retinal degeneration is related to a dysfunction of the retinal pigment epithelium. The retinal pigment epithelium (RPE) is a layer of melanin-containing cells that abut and partly surround the outer segments of photoreceptors. The RPE plays several essential functions in visual physiology (Marmor & Wolfensberger, 1998). (1) The melanin pigment in the RPE reduces light-scattering, increases visual acuity and reduces photo-damage. (2) The RPE is essential in regeneration of visual pigment in the visual cycle. The photo-bleached chromophore of the visual pigment, all-trans retinal, is metabolized and transported to the RPE, where it is regenerated to 11-cis retinal and transported back to the photoreceptor where it binds to opsin to form the visual pigment. (3) The RPE plays a fundamental role in photoreceptor renewal. Photoreceptors synthesize and assemble new outer segment disc membranes in the inner segment. Over a period of weeks, these new outer segment membranes migrate distally, where they are ultimately shed by a process that involves ingestion and phagocytosis of terminal outer segment discs by the RPE (LaVail, 1983; Besharse & Defoe, 1998; Nguyen-Legros & Hicks, 2000).
Like most epithelia, the RPE is involved in water and ion transport (Miller & Steinberg, 1977; Gallemore et al. 1997, 1998). Ion transport by the RPE is important in regulating the volume and composition of the fluid in the sub-retinal space between the outer segments and the RPE. Trans-RPE transport is mediated by the apical (photoreceptor-facing) Na+-K+-2Cl− co-transporter that uses energy from the Na+ gradient to move Cl− uphill into the cell. Basolateral Cl− channels allow Cl− ions to flow down their electrochemical gradient into the sub-retinal space between the RPE and Bruch's membrane. RPE polarity is opposite to that found in secretory epithelia, such as airway epithelium and parotid gland, where the Na+-K+-2Cl− co-transporter and the Na+-K+-ATPase are located basolaterally and Cl− secretion occurs via Cl− channels in the apical membrane. But, in RPE and secretory epithelia alike, trans-epithelial movement of Cl− is followed by Na+ as the counter-ion to neutralize charge and water to balance osmotic pressure. In light, the RPE functions as an absorptive epithelium with a net flow of NaCl and water from the neural retina (apical) towards the choroid (basolateral) (Tsuboi & Pederson, 1988; Bialek & Miller, 1994). However, in the dark, the RPE becomes secretory and there is net transport of ions into the sub-retinal space (Edelman & Miller, 1991; Huang & Karwoski, 1992). The conversion from absorptive to secretory can be mimicked by a small increase in extracellular K+ (2–5 mm) that occurs in the dark (Edelman et al. 1994b). The depolarization caused by this increase in extracellular [K+] is thought to alter the net direction of transport by perturbing the Na+-HCO3− transporter, intracellular pH, and the Cl− -HCO3− exchanger (Gallemore et al. 1997).
The hallmark diagnostic feature of Best macular dystrophy is a decrease in the slow light peak of the electro-oculogram (Francois et al. 1967; Deutman, 1969), which has been attributed to a Cl− conductance in the basolateral membrane of the RPE (Fujii et al. 1992; Gallemore & Steinberg, 1993; Gallemore et al. 1997). ClC-2 knockout mice have reduced trans-RPE potential and short circuit currents (Bosl et al. 2001). Both ClC-2 (Wills et al. 2000) and bestrophin (Marmorstein et al. 2000) have been shown to be expressed in RPE cells. These data suggest that both bestrophin and ClC-2 Cl− channels play important roles in RPE function and retinal homeostasis.
Despite the importance of Cl− channels in RPE function and in the maintenance of retinal health, there have been relatively few patch clamp studies on Cl− currents in RPE cells (see Discussion). ClC-2 currents have not been demonstrated in isolated RPE cells nor has the current that is responsible for the bestrophin-mediated current. The purpose of this investigation is to dissect and characterize the Cl− currents in Xenopus RPE cells. Xenopus was used because it has been a powerful model system for retinal and RPE physiology. Here we describe three kinds of Cl− currents, a ClC-2-like current, a Ca2+-activated Cl− current and a cAMP-activated current. This characterization provides new insights into the function of Cl− channels in the RPE.
METHODS
Isolation of xenopus RPE cells
RPE cells were isolated by a modification of the procedure of Defoe and colleagues (Uebersax et al. 2000). Adult Xenopus laevis were obtained from Xenopus One (Ann Arbor, MI, USA) and maintained on a constant 12 h light-12 h dark cycle. Animals were killed 2–3 h after light onset in the morning. They were decapitated and both the brain and spinal cord were pithed. All experiments followed the ARVO Resolution on Use of Animals in Research and were done in accordance with Institutional and NIH procedures. After removing the extra-ocular tissue, the eyes were placed in normal Ringer solution. The anterior segment including the cornea, lens, iris and ciliary body was removed by making a circular incision along the outer border of the iris. The neural retina was peeled away from the RPE with fine forceps. The inside of the eyecup was gently rinsed with Ringer solution and the eyecups were then placed in dissociation medium (96.5 mm NaCl, 3.7 mm KCl, 2 mm CaCl2, 2 mm MgCl2, 2.9 mm NaHCO3, 0.3 mm KH2PO4, 0.2 mm Na2HPO4, 8.8 mm glucose, 5 mm pyruvate, 2 mm glutamine, 25 mm Hepes, pH 7.4) containing 22 mg ml−1 Dispase (Boehringer-Mannheim) and agitated on a rotating platform for 2.5 h at room temperature. At the end of the incubation, the RPE and choroid had separated partly from the eyecup. Using a syringe and a 21-gauge needle, a vigorous stream Ringer solution was directed between the RPE and choroid. With care, it was possible to separate the RPE sheet intact from the underlying choroid. The RPE layer was rinsed twice with Ca2+- and Mg2+-free dissociation medium containing 0.5 mm EDTA and 0.05 % trypsin. After several minutes of gentle agitation, individual cells were dissociated by gentle trituration with a 5 ml pipette. Cells were collected by centrifugation at 300 g for 3 min and resuspended in 80 % L15 medium containing 10 mm glucose, 50 μg ml−1 gentamycin, 10 μg ml−1 streptomycin and 10 units ml−1 penicillin. Cells were used immediately or stored at 18 °C and used for up to 3 days.
Electrophysiological recording
Cells were patch clamped using the whole-cell configuration of the patch clamp technique as previously described in detail (Frace et al. 1993; Hirayama & Hartzell, 1997; Qu & Hartzell, 2000). Fire-polished patch pipettes had resistances of μ3 MΩ. Currents were recorded using an Axopatch 200B amplifier (Axon Instruments) filtered at 2 kHz. Currents were acquired and stored on a computer hard drive at 5 kHz using pCLAMP 8 software and a Digidata 1321 analog/digital converter. Voltage clamp protocols were controlled by the same software and interface. Voltage clamp protocols are described in the individual figures. The bath was grounded via a 3 m KCl agar bridge and a Ag-AgCl pellet. For electrophysiological recording, the bath solution contained Cs-Ringer solution (95 mm NaCl, 25 mm CsCl, 1.8 mm CaCl2, 1.0 mm MgCl2, 10 mm Hepes, pH 7.4). Intracellular solution was 103 mm CsCl, 5 mm K2EGTA, 4 mm MgCl2, 2.8 mm Na2K2ATP, 10 mm Pipes, adjusted to pH 7.15 with KOH. The bath (0.2 ml volume) was usually perfused at the rate of μ0.2 ml min−1 unless the solution composition was being changed, in which case the perfusion rate was increased to 2–3 ml min−1. Data were analysed using Origin 7.0 (Microcal).
When [Cl−] in the bathing solution was changed, it was replaced with an equimolar amount of aspartic acid. For examining the effect of pH, solutions were composed of 95 mm NaCl, 25 mm CsCl, 1.8 mm CaCl2, 1 mm MgCl2, and 10 mm pH buffer. We used Pipes for pH 6.0–7.0 and Hepes for pH 7.0 – 8.0.
Data are expressed as the mean of n cells ± standard error of the mean.
RESULTS
Figure 1 shows micrographs of acutely isolated frog RPE cells. It should be emphasized that these cells are the pigmented cells that lie in the layer that is in direct contact with the photoreceptors. More darkly pigmented cells that lie within the choroid were not included. Within 12 h of isolation, most of the cells exhibited the hour-glass morphology shown in Fig. 1A. One end of the hour-glass, presumably the apical end, was typically densely filled with pigment and exhibited numerous microvillus processes. The other half had no microvilli and contained relatively little pigment. The hour-glass shape of the cells may be due to contraction of the circumferential band of actin filaments associated with the junctional complex during cell isolation. The polarized localization of pigment in the apical half of these cells suggests that the cells retain much of their internal cytoskeletal structure. After 24 h in culture, many of the cells develop a spherical shape with microvilli distributed over the entire surface (Fig. 1B). The pigment is relatively uniformly distributed throughout the cell body. Often a protruding vestige of the pigment-free portion of the cell is observed on the underside. In some cases, the microvilli contain one or two pigment granules (Fig. 1C), but usually the microvilli are devoid of pigment (Fig. 1B).
Figure 1. Micrographs of isolated Xenopus RPE cells.

Xenopus RPE cells were isolated enzymatically as described in Methods. Calibration bar, 10 μm. A, a typical cell within 12 h of isolation. B, usual appearance of cells 24 h later. C, cells 24 h after isolation with melanin granules in the microvilli.
Whole-cell currents recorded from cells with these different morphologies were not noticeably different. Seals > 10 GΩ were obtained with ease regardless of cell morphology. We usually patched cells like those shown in Fig. 1A on the clear end. Cells like those in Fig. 1B and C were patched using positive pressure to blow the microvilli away from the approaching patch pipette and making the seal on an area of the cell between microvilli. The cells were relatively large: the diameters of the cell body (excluding the microvilli) typically ranged between 20 and 30 μm. If we assume an average cell diameter of 25 μm, one would predict a membrane capacitance of 20 pF. The average measured membrane capacitance of 135 cells was 72.7 ± 1.5 pF. This suggests that the microvilli increase the surface area of the cell about 3- to 4-fold.
Typical whole-cell currents are shown in Fig. 2. The cell was voltage clamped at a holding potential (Vhold) of −20 mV and stepped to potentials between −100 and +100 mV for 500 ms. This voltage step was followed by a 250 ms pulse to −100 mV. When the pipette solution contained 10 mm EGTA and no added Ca2+ (calculated [Ca2+]free < 20 nm), the current-voltage relationship of the current at the end of the 500 ms step was approximately linear (Fig. 2C, ○). Outward currents were time independent or decreased slightly during the pulse, while inward currents usually increased (Fig. 2A). With pipette [Ca2+]free=μ10 μm, the current-voltage relationship developed an additional small outwardly rectifying component (Fig. 2C, ▪). The outward currents elicited by the largest depolarizations showed a clear slowly activating component (Fig. 2B). In addition, the currents during the 250 ms pulse to −100 mV exhibited a pronounced deactivating tail (Fig. 2B, arrow). These results suggested that frog RPE cells had at least two types of Cl− currents: a Ca2+-independent current and a Ca2+-activated current. The following experiments were designed to characterize these currents.
Figure 2. Cl− currents in isolated Xenopus RPE cells.
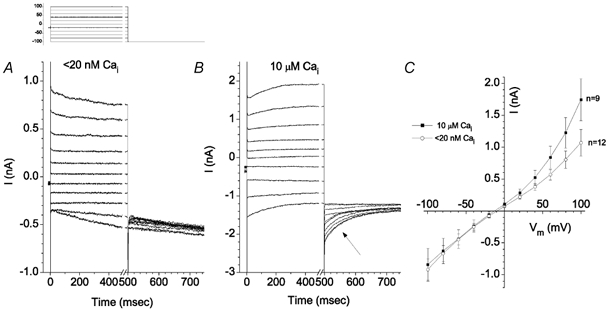
Standard extracellular and intracellular solutions are described in Methods. Cells were voltage clamped in whole-cell mode. Holding potential was −20 mV. Upper left: voltage clamp protocol. A, traces recorded from a cell with the pipette solution containing < 20 nm free Ca2+. B, traces recorded from a cell with the pipette solution containing 10 μm free Ca2+. C, average steady-state current-voltage relationships for cells with < 20 nm Ca2+ (○, n = 12) or 10 μm free Ca2+ (▪, n = 9).
Ca2+-independent currents
To characterize Ca2+-independent currents, all experiments in the following section used pipette solutions with [Ca2+]free < 20 nm. In Fig. 2A, the inward current at 100 mV had not reached steady-state at the end of the 500 ms pulse, so a voltage protocol with a 1.5 s duration pulse was used (Fig. 3). In response to hyperpolarizing test pulses, a time-independent instantaneous current was followed by a large, slowly activating inward current (Fig. 3A). The time-dependent component was activated only at negative potentials. Its activation was well-fitted with a single exponential which was voltage sensitive. In the example shown in Fig. 3, τact was 585 ms at −120 mV and 1016 ms at −80 mV. On average, τact at −120 mV was 524 ± 64 ms (n = 5).
Figure 3. Ca2+-independent currents in Xenopus RPE cells.
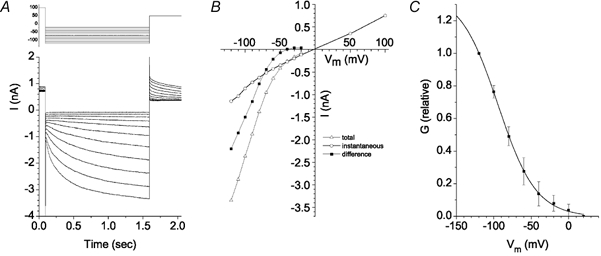
Holding potential was −20 mV. Cells were depolarized to +100 mV for 500 ms prior to hyperpolarizing to various potentials as shown in the voltage clamp protocol in A. A, current traces showing an instantaneous time-independent inward current followed by a slow time-dependent activation of an inward current upon hyperpolarization. Deactivating tail currents are observed upon depolarization to +50 mV. B, current-voltage relationships. ○, instantaneous current at onset of voltage pulse. This current was defined as Ibkg. ▵, total current at the end of the 1.5 s hyperpolarizing pulse. ▪, the time-dependent current obtained by subtracting the instantaneous current from the total current. This time-dependent current was defined as ICl,ir. C, activation curve for ICl,ir. The conductance (G) for ICl,ir was determined by measuring the instantaneous amplitude of the tail currents upon repolarizing to +50 mV as in A and dividing by the driving force (50 mV). G for each tail current was plotted vs. the voltage of the preceding hyperpolarizing pulse. (n = 5; ±s.e.m.).
The instantaneous current could be separated from the time-dependent current by its voltage dependence and pharmacology. Figure 3B plots the I-V curve of the instantaneous current at the onset of the 1.5 s hyperpolarizing pulse (the background current, Ibkg, ○) and the total current at the end of the pulse (▵). The difference between the total current and Ibkg was defined as the inwardly rectifying Cl− current (ICl,ir, ▪). Ibkg exhibited a linear I-V relationship and had a reversal potential (Erev) near 0 mV. ICl,ir activated at negative potentials and was strongly inwardly rectifying. The activation curve of ICl,ir was determined by measuring the amplitude of the tail currents evoked by depolarizations to +50 mV following the 1.5 s test pulses. The conductance, G, was calculated from the tail current (Itail/50 mV) and plotted as a function of membrane potential (Vm) during the preceding test pulse (Fig. 3C). The average data from five cells were fitted to the Boltzmann equation. ICl,ir activated significantly only at potentials negative to 0 mV and was 50 % activated at −94 ± 3 mV (n = 5). This value was subject to some uncertainty because it was not possible to hyperpolarize the cell to potentials that fully activated ICl,ir and, therefore, Gmax was not accurately known.
Pharmacological separation of ICl,ir and Ibkg
Zinc
ICl,ir resembled currents carried by cloned ClC-2 channels. ClC-2 is blocked by Zn2+, is stimulated by acid and suppressed by alkali, and is relatively insensitive to DIDS. Figure 4 shows the effect of Zn2+ on inward Cl− currents. Zn2+ blocked Ibkg and ICl,ir with different IC50 values (5.3 μm Zn2+ for Ibkg; 185 μm Zn2+ for ICl,ir; Fig. 4D–F).
Figure 4. Ibkg and ICl,ir have different sensitivities to Zn2+ blockade.
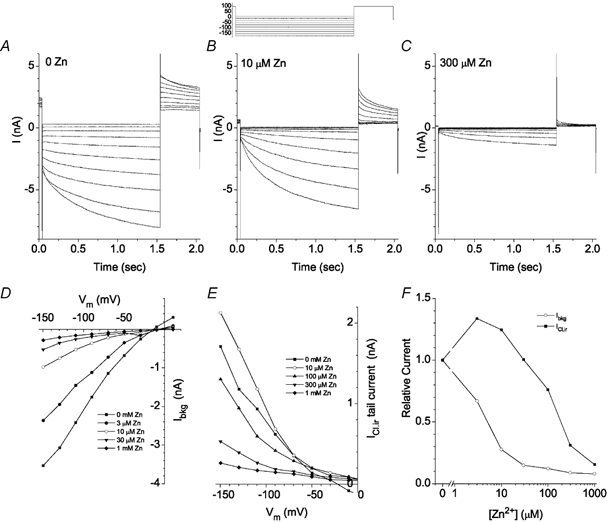
The voltage protocol is shown above B; this experiment is typical of 5 cells. A-C, current traces recorded from an isolated Xenopus RPE cell in Ringer solution (A) and in Ringer solution containing 10 μm (B) or 300 μm (C) Zn2+. D, current-voltage relationship of the instantaneous current at the onset of the hyperpolarizing pulse (Ibkg) in 0 (▪), 3 μm (•), 10 μm (○), 30 μm (▾) and 1 mm (♦) Zn2+. E, current-voltage relationship for ICl,ir tail currents recorded at +100 mV in 0 (▪), 10 μm (○), 100 μm (▴), 300 μm (▾), and 1 mm (♦) Zn2+. Virtually identical results were obtained if the time-dependent inward current rather than tail current amplitude was used as a measure of ICl,ir. F, inhibition of Ibkg and ICl,ir by Zn2+. Ibkg and ICl,ir in different [Zn2+] were normalized to the control current in the absence of Zn2+.
Interestingly, low concentrations of Zn2+ stimulated ICl,ir about 30 % (Fig. 4F). This can be seen by comparing panels A (control) and B (10 μm Zn2+) of Fig. 4. The instantaneous current at the onset of the test pulse was reduced μ75 % by 10 μm Zn2+, but the time-dependent inward current (measured as the difference between the total current at the end of the pulse and the instantaneous current at the onset of the pulse) was increased about 30 %. The same was true of the time-dependent component of the tail current measured at +50 mV. The experiment shown is typical of five cells.
Gadolinium
Ibkg was blocked by low concentrations of Gd3+, while ICl,ir was either unaffected or slightly stimulated. Figure 5 shows the effect of 10 μm Gd3+. Hyperpolarizing test pulses evoked a large instantaneous current followed by a slowly developing inward current (Fig. 5A). Application of 10 μm Gd3+ significantly reduced the instantaneous current (Fig. 5B). Figure 5C and D compare the I-V relationships in the absence and presence of Gd3+. The slope conductance of Ibkg (measured from the I-V curves in Fig. 5C and D, □) decreased from 10.9 to 2.4 nS in the presence of Gd3+. In contrast, the time-dependent current (ICl,ir) apparently increased. The apparent increase, however, may be related to the inactivation of Ibkg at the most negative potentials. We did not study Ibkg in detail. Because the current exhibited an Erev near 0 mV, the current may be a Cl− current or a non-selective current. The current often decreased with time of recording.
Figure 5. Effect of Gd3+ on Ibkg.
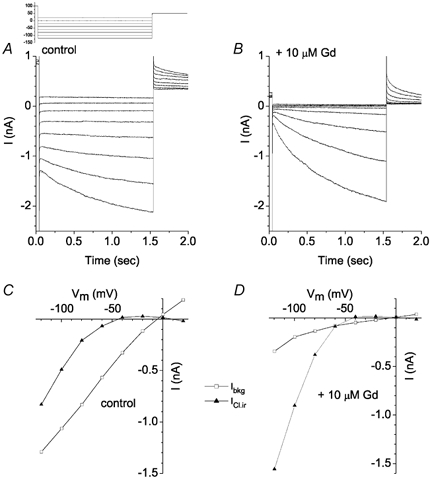
The voltage clamp protocol is shown in the inset. Current traces in the absence (A) and presence of 10 μm Gd3+ (B) are shown. C, control current-voltage relationships of the instantaneous current, Ibkg (□), and time-dependent current, ICl,ir (▴), in the absence of Gd3+. D, current-voltage relationships of the currents in the presence of 10 μm Gd3+. This experiment is typical of 5 cells.
Properties of ICl,ir
pH sensitivity
ICl,ir was strongly pH dependent. To examine ICl,ir in isolation, Ibkg was reduced with 10 μm Gd3+. Extracellular pH was changed by replacing the normal pH 7.3 Hepes-buffered bathing solution with solutions buffered to different pH with the same ionic composition and osmolarity. At pH 6, currents were about 5 times larger than they were at pH 8 (Fig. 6). The decrease in current by alkalinization was due to a decrease in Gmax without any appreciable change in voltage sensitivity. Although we did not extensively characterize the response of ICl,ir to pH, our data is consistent with recent studies on a very similar inwardly rectifying Cl− current in parotid gland (Arreola et al. 2002).
Figure 6. pH dependence of ICl,ir.

Voltage protocol as in Fig. 5. Solutions contained 10 μm Gd3+. A-C, current traces in solution of pH 6 (A), pH 7 (B) and pH 8 (C). D, mean relative amplitude of ICl,ir at different pH. Currents measured at −130 mV were normalized to the current at pH 7. This experiment is typical of 3 cells.
DIDS sensitivity
ICl,ir block by 500 μm DIDS was voltage dependent (Fig. 7). At −120 mV, ICl,ir was blocked only about 40 %; however, at potentials more positive than −80 mV, the current was blocked almost completely (Fig. 7C).
Figure 7. ICl,ir is blocked by DIDS in a voltage-dependent manner.
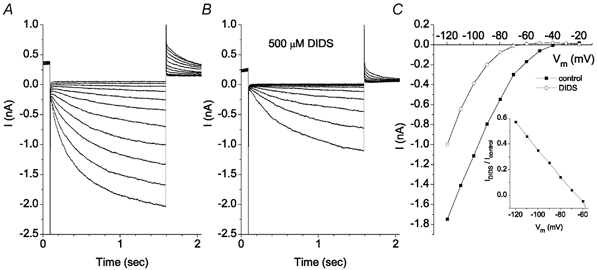
Voltage protocol as in Fig. 3. Solutions contained 10 μm Gd3+. A, control traces. B, traces recorded in the presence of 0.5 mm DIDS. C, current-voltage curves in the control solution (▪) and in 0.5 mm DIDS (○). Inset: the fraction of current not blocked by DIDS is plotted vs. membrane potential. This experiment is typical of 3 cells.
Chloride dependence
The ionic selectivity of ICl,ir was tested by measuring the dependence of Erev of the current on extracellular [Cl−]. The cell was hyperpolarized to −120 mV for 1.5 s to activate ICl,ir and the instantaneous tail current at different potentials was measured with extracellular [Cl−]= 125.6 mm or 30.6 mm (Cl− was replaced with aspartate). Figure 8 shows a typical example. Erev of ICl,ir with [Cl−]o= 125.6 mm was 0.8 mV, very close to the calculated ECl (Cl− equilibrium potential) of −3 mV. When [Cl−]o was changed to 30.6 mm, Erev shifted to +29.8 mV. In three cells, the average shift in Erev was 30.9 ± 5 mV. These data show that the hyperpolarization-activated current is carried largely by Cl−. The Erev shift was less than the expected 36.8 mV shift predicted by the Goldman-Hodgkin-Katz (GHK) equation. These data can be explained in several ways. One possibility is that the channel is permeable to aspartate. From the GHK voltage equation:
(where PAsp and PCl are aspartate and chloride permeabilities, repectively, and z, F, R and T have their usual thermodynamic meanings) we would calculate that aspartate was 0.38 times as permeable as Cl−. Another possibility is that the channel is permeable to cations. However, because the major intracellular cation is Cs+ and the major extracellular cation is Na+, the near-zero reversal potential for the current with symmetrical [Cl−] would require that Na+ and Cs+ be equally permeable. Franciolini & Nonner (1994) have shown that Cl− permeation in background Cl− channels in rat hippocampal neurons occurs via a multi-ion permeation mechanism involving anion-cation pairs. This may be a common property of anion channels, because frequently the change in Erev of Cl− channels is less than predicted if the channel was strictly selective for Cl−.
Figure 8. Cl− sensitivity of ICl,ir.
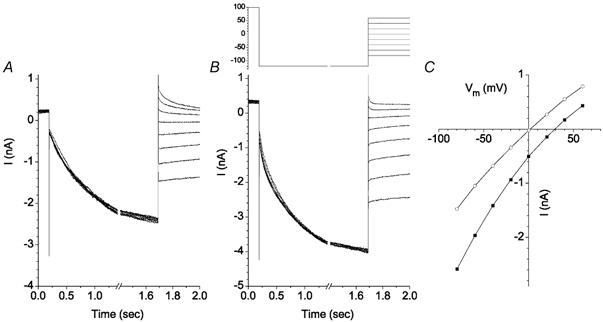
The voltage clamp protocol is shown above B. The solutions contained 10 μm Gd3+. A, current traces recorded with 125.6 mm Cl− in the bath solution. B, current traces recorded with 30.6 mm Cl− in the bath solution. C, instantaneous current-voltage relationships measured at the onset of the voltage step after the −120 mV hyperpolarizing pulse. ▪, 125.6 mm Cl−. ○, 30.6 mm Cl−. Typical of 3 experiments.
Ca2+-activated Cl− current
As noted above, when free [Ca2+] in the pipette was increased to 1 μm, the outward current was slightly larger on average and exhibited some time-dependent activation kinetics (Fig. 2). This suggested the presence of a Ca2+-activated Cl− current, but it was difficult to demonstrate this current convincingly without blocking other Cl− currents. Because the Ca2+-activated Cl− current in Xenopus oocytes is not blocked by Zn2+ (authors' unpublished observations), whereas ICl,ir and Ibkg were blocked by Zn2+, we examined the effect of Zn2+ on currents recorded with high [Ca2+]i.
Figure 9 compares the effect of extracellular 1 mm Zn2+ on two cells, one with < 20 nm free [Ca2+]i, the other with 10 μm free [Ca2+]i. With low [Ca2+]i (Fig. 9A and B), addition of Zn2+ to the bath blocked both ICl,ir and Ibkg: the remaining currents were less than ± 0.5 nA in amplitude at the extreme voltages. In contrast, with high [Ca2+]i (Fig. 9D and E), addition of Zn2+ reduced the inward current to < 0.2 nA at −100 mV, but μ1 nA of outward current remained at +100 mV. The outward current exhibited slow activation at positive potentials and deactivating tail currents at −100 mV (Fig. 9E, arrow). The average I-V relationships for cells with low [Ca2+]i (Fig. 9C) or high [Ca2+]i (Fig. 9F) in the presence (○) and absence (▪) of 1 mm Zn2+ show that with high [Ca2+]i, the outward current at +100 mV was 2.5 times as large as with low [Ca2+]i. This is shown in another way in Fig. 9G, where the fraction of total current that was insensitive to Zn2+ was calculated at each potential. The ratio was greater for high [Ca2+]i than low [Ca2+]i at all potentials, but the difference was particular marked at positive potentials. The Zn2+-insensitive current in the presence of high [Ca2+]i was defined as ICl,Ca. This current was outwardly rectifying (Fig. 9F, ○).
Figure 9. Effect of Zn2+ on currents in cells recorded with high and low cytoplasmic [Ca2+].
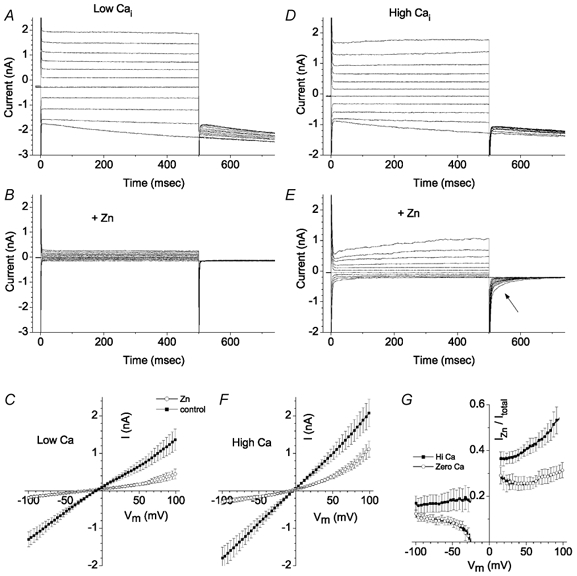
A-C, < 20 nm[Ca2+]i. D-F, 10 μm[Ca2+]i. Currents were recorded in control Ringer solution (A and D) and then 1 mm ZnCl2 was added (B and E). In E note the deactivating tail current (arrow). C and F, average (n = 8) current-voltage relationships for cells with < 20 nm[Ca2+]i (n = 7) (C) and 10 μm[Ca2+]i (F). Current-voltage relationships were determined from a voltage ramp protocol consisting of a 225 ms pulse to −100 mV followed by a 1 s ramp to 100 mV. G, fraction of Zn2+-insensitive current. The ratio of currents in the absence and presence of 1 mm Zn2+ (from C and F) was calculated at each potential. between −20 and +20 mV the values are blanked because the signal-to-noise ratio of the currents was too large to calculate a reliable ratio.
A more detailed analysis of ICl,Ca is shown in Fig. 10. With 10 μm[Ca2+]i intracellularly and 1 mm Zn2+ in the extracellular solution, depolarizing voltage steps elicited outward currents that increased slowly after an initial instantaneous jump (Fig. 10A). With steps to +100 mV, the time-dependent component increased as a single exponential having a time constant of μ325 ms. Upon repolarization to −100 mV, the current deactivated as a single exponential (quantified below). The steady-state I-V curve was strongly outwardly rectifying (Fig. 10B). In a few rare cells, ICl,ir and Ibkg were very small in control solution even without Zn2+. In these rare cells, the properties of ICl,Ca were virtually identical to ICl,Ca observed in cells recorded in the presence of Zn2+ (Fig. 10C).
Figure 10. Ca2+-activated Cl− current in Xenopus RPE cells.
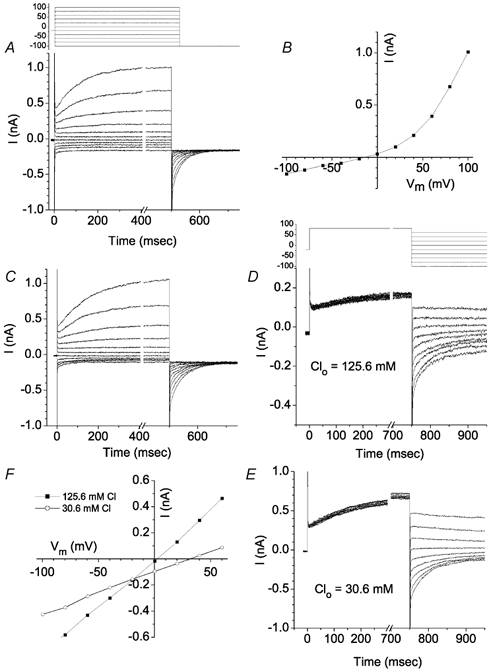
Voltage protocol for A and C is shown above A. Voltage protocol for D and E is shown above D. A, Ca2+-activated Cl− current in a cell bathed in Cs-Ringer solution containing 1 mm Zn2+. B, steady-state current-voltage relationship for the traces in A. Currents were measured at the end of the 500 ms pulse. C, ICl,Ca in a rare cell that had very small Ibkg and ICl,ir currents in the absence of Zn2+. D-F, Cl− dependence of ICl,Ca. ICl,Ca was activated by a 750 ms pulse to +80 mV and the amplitude of the tail currents at different potentials was measured with 125.6 mm (D) or 30.6 mm (E) [Cl−]o. ICl,ir and Ibkg were blocked with 1 mm Zn2+. F, instantaneous current-voltage relationships of ICl,Ca recorded in low (○) and normal (▪) extracellular [Cl−].
Ionic selectivity
ICl,Ca was Cl−-selective (Fig. 10D–F). The instantaneous I-V curve of ICl,Ca was determined by measuring the tail currents at different potentials after activating ICl,Ca by a pulse to +80 mV (Fig. 10D and E). Ibkg and ICl,ir were blocked with 1 mm Zn2+. Upon changing extracellular [Cl−] from 125.6 mm to 30.6 mm, Erev shifted 30 mV (Fig. 10F), which was close to the 36.8 mV predicted for a Cl−-selective channel.
Kinetics
Analysis of the kinetics of the tail currents from records such as those in Fig. 10D are shown in Fig. 11. Figure 11A shows an example of single exponential fits of the tail currents and Fig. 11B plots the deactivation time constants (τdeact) vs. Vm. The time constants became faster with hyperpolarization. These data were fitted with the equation:
This equation predicts a charge movement q of 0.32. A and b are constants. These data are consistent with a gating scheme in which channel closure is voltage dependent. Similar voltage-dependent tail current kinetics have been analysed in our previous studies with Xenopus oocyte Ca2+-activated Cl− channels at low [Ca2+] (Kuruma & Hartzell, 2000).
Figure 11. Kinetics of ICl,Ca.

A, tail currents of ICl,Ca were fitted to single exponentials. B, time constants of tail current deactivation (determined by fits in A) were dependent on membrane potential as expected from a voltage-dependent step in channel gating. These data are from the same experiment as shown in Fig. 10.
Regulation of Ca2+-activated Cl− current by extracellular Ca2+
ICl,Ca was also stimulated by elevated levels of extracellular Ca2+ (Fig. 12). Switching from normal Cs-Ringer solution containing 1.8 mm Ca2+ to one containing 10 mm Ca2+ had two effects: a time-dependent outward current resembling ICl,Ca was stimulated and the inward current (mostly ICl,ir) was reduced. These changes are seen clearly in the I-V curve, where the outward current at the end of the 500 ms pulse was increased > 3-fold, whereas the inward current was reduced > 2-fold. This interesting result suggests that ICl,Ca and ICl,ir may be reciprocally regulated.
Figure 12. Stimulation of ICl,Ca by extracellular Ca2+.
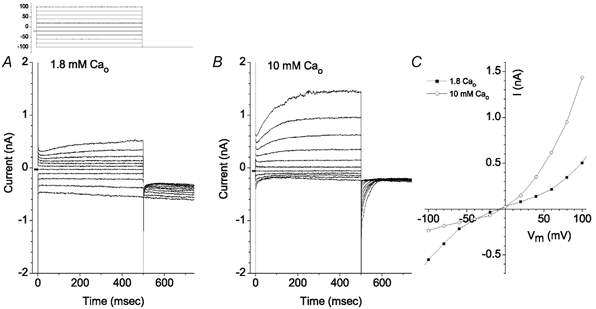
Standard intracellular solution contained 5 mm EGTA and no added Ca2+. Voltage clamp protocol is shown above panel A. A, when the bath solution contained 1.8 mm Ca2+, only a small time-dependent outward current was observed. Deactivating tail currents at −100 mV were not seen. B, increasing bath [Ca2+] to 10 mm stimulated outward current and a large deactivating tail current (arrow) was observed. C, current-voltage relationships of the currents in A and B. ○, 10 mm[Ca2+]o. ▪, 1.8 mm[Ca2+]o.
cAMP-activated Cl− current
These cells also exhibited a cAMP-activated Cl− current (Fig. 13). Addition of 20 μm forskolin and 100 μm isobutyl methylxanthine (IBMX) to the bath caused an elevation in current (Fig. 13A–C). The current reached a steady level about 1–2 min after complete replacement of the bath with the forskolin + IBMX solution (Fig. 13D).Washout of forskolin + IBMX resulted in a decline in current (Fig. 13D). The current after washout of forskolin + IBMX was often less than the control current before addition of forskolin + IBMX (compare A and C in Fig. 13). Figure 13E shows the I-V curves before, during and after washout with forskolin + IBMX and Fig. 13F shows the forskolin + IBMX-stimulated current obtained by subtracting the current before forskolin + IBMX from the current in the presence of forskolin + IBMX. The forskolin + IBMX-stimulated current is essentially linear. The current reversed at 0 mV as expected for a Cl− current.
Figure 13. cAMP-stimulated current.
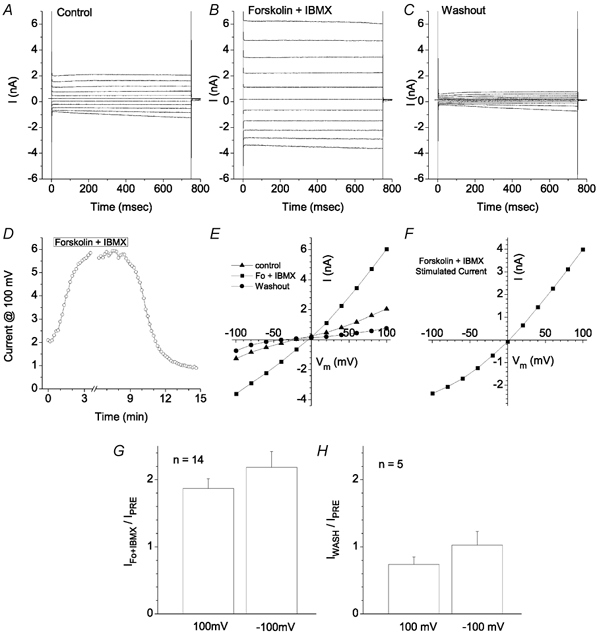
The voltage clamp protocol was a series of 750 ms duration pulses from a holding potential of 0 mV to potentials between −100 mV and 100 mV in 20 mV steps. A, control traces before addition of 20 μm forskolin and 100 μm IBMX to the bath. B, traces 5 min after addition of forskolin + IBMX. C, traces 5 min after washout of forskolin + IBMX. D, time course of the effect of forskolin + IBMX. Forskolin + IBMX was applied for the period indicated. The bath was < 0.2 ml and the bath was changed at a rate of 4 ml min−1. E, current-voltage relationships of the currents shown in panels A-C. ▴, control current. ▪, 5 min after addition of forskolin + IBMX. •, 5 min after washout of forskolin + IBMX. F, I-V curve of the forskolin + IBMX-stimulated current obtained by subtracting the control current from the current in the presence of forskolin + IBMX in panel E. G, average increase in current in response to forskolin + IBMX. Currents were measured at +100 mV and −100 mV. The current 3–5 min after addition of forskolin + IBMX was divided by the current before forskolin + IBMX (n = 14). H, average effect of washout of forskolin + IBMX. The current 5 min after washing out forskolin + IBMX was divided by the current before forskolin + IBMX (n = 5).
Fourteen of sixteen cells tested between 18 and 30 h after isolation responded to forskolin + IBMX with an increase in current. On average the outward current at +100 mV 5 min after adding forskolin + IBMX was 1.87 ± 0.15 times the amplitude of the current before forskolin + IBMX in the 14 cells that responded (Fig. 13G). The inward current at 100 mV was slightly larger, but this increase may include a small cAMP-independent run-up of ICl,ir during this time period. Upon washing out forskolin + IBMX in five of the cells, the outward current at +100 mV was on average about 25 % less than the amplitude of the initial current before forskolin + IBMX (Fig. 13H).
In contrast to the robust responses that were observed μ2 day after isolation, 6/6 cells tested within 5 h of isolation failed to respond to forskolin + IBMX. We do not know if this failure is a deleterious consequence of the isolation procedure or whether the forskolin + IBMX response develops as a result of the removal of cells from their native epithelial environment.
DISCUSSION
Ionic currents in RPE cells
The work of Sheldon Miller, Roy Steinberg and their colleagues has provided insights into ion and fluid transport by the RPE (Gallemore & Steinberg, 1993; Gallemore et al. 1997). Their microelectrode studies on isolated RPE-choroid sheets in modified Ussing chambers have identified the major transport pathways in these cells. Vectorial transport across the RPE, like other epithelia, is mediated by the segregation of different transporters and channels to the apical and basolateral membranes. RPE polarity is opposite to that found in secretory epithelia, such as parotid gland and respiratory epithelia, where the Na+-K+-2Cl− co-transporter and the Na+-K+-ATPase are located basolaterally and Cl− secretion occurs via Cl− channels in the apical membrane. Rather, in light the RPE absorbs fluid and salt from the space surrounding the photoreceptors (sub-retinal space) and transports it in the direction of the choroid (Fig. 14, left panel). This trans-RPE transport is mediated by apical (photoreceptor-facing) Na+-K+-2Cl− co-transporters that use the energy from the Na+ gradient provided by the apical Na+-K+ pump to move Cl− uphill into the cell. Basolateral Cl− channels allow Cl− ions to flow down their electrochemical gradient into the space between the RPE and Bruch's membrane (Fujii et al. 1992; Bialek & Miller, 1994; Rymer et al. 2001; Quinn et al. 2001). Trans-epithelial movement of Cl− is followed by Na+, as counter-ion to neutralize charge, and water to balance osmotic pressure. Thus, there is a net flow of NaCl and water from the neural retina to the choroid in light (Tsuboi & Pederson, 1988; Bialek & Miller, 1994).
Figure 14. Working model of RPE transport.
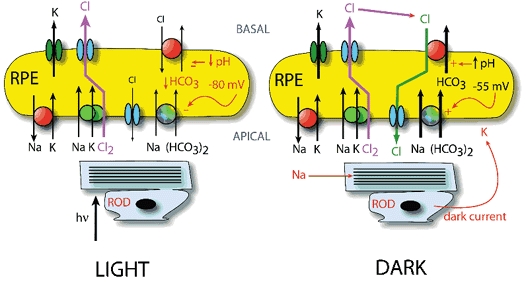
This model comes largely from the work of Miller and colleagues (Gallemore et al. 1997). The RPE cell is drawn above the photoreceptor (rod). Left panel: RPE transport in the light. Right panel: RPE transport in the dark. The apical membrane contains the Na+-K+-ATPase, the Na+-K+-2Cl− cotransporter, and the Na-bicarbonate exchanger. The basolateral membrane contains a K+ channel, at least one type of Cl− channel, and the Cl−-HCO3− exchanger. The size of the arrows suggests relative magnitude of flux. In the dark, the membrane potential of the RPE cell is depolarized by the external K+ provided by the photoreceptor dark current. In light the membrane is hyperpolarized. The change in membrane potential alters the driving force for the Na+-HCO3− transporter and cytosolic pH, which affects the Cl−-HCO3− transporter. The net result is a decreased ‘recycling’ of Cl− at the basolateral membrane in the light so that net Cl− flux changes direction from basal-to-apical in the dark to apical-to-basal in light.
The direction of net ion and water transport is thought to switch from absorption in light to secretion in the dark (Gallemore et al. 1997) (Fig. 14, right panel). This is in part explained by light-dependent differences in the activity of the basolateral Cl−-HCO3− exchanger. In the dark, the apical membrane potential of the RPE is depolarized (from about −70 mV to −55 mV) because the photoreceptor dark current generates K+ that accumulates in the sub-retinal space. The depolarized membrane potential drives increased HCO3− uptake via Na+-HCO3− transporters in the apical membrane. The increased cytosolic HCO3− alkalinizes the cytosol which stimulates the basolateral Cl−-HCO3− exchanger (Edelman et al. 1994a; Lin & Miller, 1994; Kenyon et al. 1997). The increased activity of the Cl−-HCO3− exchanger provides a powerful pathway for Cl− uptake by the basolateral membrane. As a consequence, Cl− secreted by basolateral Cl− channels is ‘recycled’ by absorption by the Cl−-HCO3−exchanger in the same membrane. This re-cycling changes the balance of absorptive and secretory pathways such that the net direction of Cl− movement is now towards the sub-retinal space and the RPE behaves as a net secretory epithelium.
Despite this rather good level of understanding of RPE transport at the epithelial level, the underlying Cl− channels remain to be defined at the cellular level. There is good evidence that Cl− exits the basolateral membrane by a DIDS-sensitive Cl− channel (Gallemore & Steinberg, 1989a,1989b; Miller & Edelman, 1990; Joseph & Miller, 1991; Fujii et al. 1992; Gallemore et al. 1993; Bialek & Miller, 1994). This conductance under control conditions is estimated to be 20–45 % of the total basolateral conductance. But, the nature of these channels is unknown. It has been suggested that the basolateral Cl− channels are likely to be Ca2+-activated and/or cAMP-activated (Gallemore et al. 1997), but the data supporting this suggestion is largely indirect.
cAMP
In isolated RPE-choroid preparations from frog (Rana catesbiana), it has been shown that cAMP increases short circuit current, increases trans-epithelial potential, decreases trans-epithelial resistance, and decreases the ratio of basolateral to apical resistance (Miller & Farber, 1984; Hughes et al. 1987, 1988). Although these observations are consistent with an increase in basolateral conductance, the changes in the electrical properties of the epithelium in response to cAMP are somewhat complex and consist of several phases. Stimulation of the Na+-K+ pump seems to be responsible for a significant fraction of the response whereas an increase in basolateral conductance is probably transient (Hughes et al. 1988). Patch clamp studies have demonstrated a small cAMP-activated Cl− current in frog RPE cells and, by analogy to secretory epithelia, it has been suggested that this is mediated by CFTR (cystic fibrosis transmembrane conductance regulator; Hughes & Segawa, 1993). However, the cAMP-activated current in frog RPE is blocked completely by 0.2 mm DIDS, whereas mammalian CFTR is DIDS-insensitive (Schultz et al. 1999).
The generality of a cAMP-elevated basolateral conductance is brought into question by the observations that in bovine and chick RPE, cAMP actually decreases basolateral Cl− conductance (Kuntz et al. 1994). Human RPE cells express CFTR message and stain with CFTR antibodies (Wills et al. 2000; Weng et al. 2002). cAMP stimulates a current in primary cultures of human RPE by about 40 % (Weng et al. 2002), but the properties of this current remain to be analysed in detail.
Ca2+-activated Cl− current
The evidence for the existence of a Ca2+-activated Cl− current in RPE-choroid preparations is good, but the mechanisms of its regulation remain unclear. α-Adrenergic agonists increase Ca2+ concentration (Rymer et al. 2001) and basolateral Cl− conductance (Joseph & Miller, 1992; Quinn et al. 2001) in bovine RPE-choroid preparations. In Bos taurus, the effects of α-agonists are blocked by BAPTA and mimicked by the Ca2+ ionophore A23187 (Joseph & Miller, 1992). In RPE-choroid sheets from human fetus, ionomycin and noradrenaline (norepinephrine) produce electrical changes consistent with increases in a basolateral Cl− conductance (Quinn et al. 2001). The current is blocked by DIDS applied to the basal side of the RPE.
The only patch clamp studies on Ca2+-activated Cl− currents are in isolated rat RPE cells. In rat, elevation of cytosolic Ca2+ by addition of Ca2+ into the patch pipette, by application of ionomycin or by application of thapsigargin, is not sufficient to stimulate a sustained Cl− current (Botchkin & Matthews, 1993; Strauss et al. 1996, 1999). However, Cl− currents are activated by intracellular IP3 or, paradoxically, by BAPTA (Strauss et al. 1999). The effect of extracellular Ca2+ is not clear. Strauss et al. (1999) report that the IP3-mediated Cl− current is independent of extracellular Ca2+. In contrast, Ueda & Steinberg (1994) report that re-addition of extracellular Ca2+ stimulates a Cl− current after depletion of cytosolic Ca2+ with zero-Ca2+ solution and ionomycin. The current is non-rectifying and is time independent. The observation that the elevation of the current was reduced by inhibitors of Ca2+-calmodulin kinase-II and tyrosine kinases suggested that protein kinases may play a role in regulation of this Ca2+-activated Cl− current (Strauss et al. 1999).
The Ca2+-activated Cl− current we observe differs from the rat RPE Ca2+-activated Cl− currents in several respects: the current is activated in a sustained manner by increases in cytosolic [Ca2+] by inclusion of Ca2+ in the patch pipette and is not activated by BAPTA. The current was activated by extracellular Ca2+ as well as intracellular Ca2+. The current differs from the Ca2+-activated Cl− currents we have studied in Xenopus oocytes in that the current is strongly outwardly rectifying, even with 10 μm intracellular [Ca2+] (Qu & Hartzell, 2000; Kuruma & Hartzell, 2000). Whether this reflects strong local buffering of Ca2+ or whether the Cl− currents themselves differ remains to be determined.
Other Cl− currents
Although it has been shown that ClC-2, ClC-3, and ClC-5 are expressed in RPE (Wills et al. 2000; Weng et al. 2002), the corresponding currents have not been previously identified. The current that we call ICl,ir has many of the characteristic features of ClC-2: it is hyperpolarization-activated, inwardly rectifying, activated by acid, and blocked by zinc. Although the cloned ClC-2 current is considered to be rather insensitive to DIDS (Jentsch et al. 2002), ICl,ir is blocked by DIDS in a voltage-dependent manner. We hypothesize that ICl,ir is mediated by ClC-2, but unequivocal identification of ICl,ir must await further molecular studies.
Physiological significance
The RPE plays a very important role in retinal physiology. The RPE regenerates the visual pigment and removes worn-out photoreceptor discs during the disc shedding process and also regulates the composition of the extracellular space surrounding the photoreceptors (Marmor & Wolfensberger, 1998). A major gap in our understanding of RPE transport is that the identities of the basolateral and apical Cl− channels in RPE cells remain unknown. From our studies, we propose that the channels responsible for ICl,ir are located on the basolateral membrane. This hypothesis is based on the fact that in secretory epithelia, the ClC-2 channel, which we think is responsible for ICl,ir, is located on the opposite face of the epithelium to the Na+-K+-ATPase and Na+-K+-2Cl− transporter (Mohammad-Panah et al. 2001; Nehrke et al. 2002). In RPE, the Na+-K+-ATPase and Na+-K+-2Cl− cotransporter are located on the apical membrane (opposite to their location in secretory epithelia), so we hypothesize that ClC-2 is a basolateral Cl− channel in RPE. Is this the major basolateral Cl− conductance? The major basolateral Cl− conductance in toad RPE-choroid preparations is blocked μ90 % by 500 μm DIDS applied to the basolateral side (Fujii et al. 1992). In our experiments at potentials more positive than −80 mV, ICl,ir was nearly completely blocked by the same concentration of DIDS. DIDS block of ICl,ir was voltage dependent, as it is for other Cl− channels (Qu & Hartzell, 2001), so at very negative potentials the inhibition was less. The trans-membrane potential of the basolateral membrane of frog RPE cells has been reported to be −69 mV in the light (Miller & Steinberg, 1977). Cytosolic Cl− activity measured by ion-sensitive microelectrodes is 14.5 (LaCour, 1992), which would place ECl in the range of −45 mV. Thus, ICl,ir would be suited for transport of Cl− towards the choroid. Whether ICl,ir is regulated by phosphorylation or other factors remains to be determined, but in the dark, when the RPE depolarizes, Cl− efflux via ICl,ir would be expected to decrease both because the driving force for Cl− is decreased, but also because of the reduced activation of ICl,ir channels at more depolarized potentials. This is consistent with the proposed decreased absorption by the RPE in the dark.
In secretory epithelia, the regulated ion channels on the apical membrane that open during secretion include CFTR and Ca2+-activated Cl− channels. On this basis, we would anticipate that the cAMP-activated Cl− current and the Ca2+-activated Cl− current that we have observed here would both be located on the basolateral membrane. If this is true, stimulation of these channels would be expected to increase the Cl− flux across the basolateral membrane. If these channels are activated in the light, these would contribute to Cl− absorption.
The cAMP-activated Cl− current is slightly outwardly rectifying, but has significant current-carrying capability at negative membrane potentials. In contrast, the Ca2+-activated Cl− current (ICl,Ca) is strongly outwardly rectifying. At the membrane potentials of frog RPE in light (-69 mV), one would expect very little inward current (outward Cl− ion movement) through this channel, especially considering that the driving force for Cl− efflux is lower in the intact epithelium than under our patch clamp conditions. What, then, would be the function of an outwardly rectifying Cl− channel? Although the inward current via ICl,Ca is small, it may not be insignificant. For example, many inwardly rectifying K+ channels carry very little current at potentials positive to EK (K+ equilibrium potential), but nevertheless play an important role in regulation of membrane potential. It has been suggested that Ca2+-activated Cl− channels are a component of the basolateral Cl− conductance and that this conductance is activated by light (Rodriguez de Turco et al. 1992; Strauss et al. 1999). It is known that IP3 levels in RPE increase in response to light (Rodriguez de Turco et al. 1992). This idea is consistent with a switch of the RPE from secretory to absorptive in the light.
Apical membrane Cl− channel
Under conditions where the direction of net transport reverses from absorption to secretion, one might expect that in addition to decreased activity of basolateral Cl− channels there would be activation of an apical Cl− channel. It seems unlikely that Cl− secretion from the apical membrane could be accomplished by a reversal in the direction of the Na+-K+-2Cl− cotransporter, which is the only known Cl− transport pathway in the apical membrane. The identity of such a hypothetical apical Cl− channel remains to be determined.
Acknowledgments
We thank Raymond Wei for expert technical assistance and Drs Joseph Besharse, Dennis Defoe and Michael Iuvone for helpful discussion. This work was funded by NIH grant GM-60448.
REFERENCES
- Arreola J, Begenisich T, Melvin JE. Conformation-dependent regulation of inward rectifier chloride channel gating by extracellular protons. J Physiol. 2002;541:103–112. doi: 10.1113/jphysiol.2002.016485. [DOI] [PMC free article] [PubMed] [Google Scholar]
- Besharse JC, Defoe D. The role of retinal pigment epithelium in photoreceptor membrane turnover. In: Marmor MF, Wolfensberger TJ, editors. The Retinal Pigment Epithelium: Function and Disease. New York: Oxford University Press; 1998. pp. 152–172. [Google Scholar]
- Bialek S, Miller SS. K+ and Cl− transport mechanisms in bovine pigment epithelium that can modulate subretinal space volume and composition. J Physiol. 1994;475:401–417. doi: 10.1113/jphysiol.1994.sp020081. [DOI] [PMC free article] [PubMed] [Google Scholar]
- Bosl MR, Stein V, Hubner C, Zdebik AA, Jordt SE, Mukhopadhyay AK, Davidoff MS, Holstein AF, Jentsch TJ. Male germ cells and photoreceptors, both dependent on close cell-cell interactions, degenerate upon ClC-2 Cl− channel disruption. EMBO Journal. 2001;20:1289–1299. doi: 10.1093/emboj/20.6.1289. [DOI] [PMC free article] [PubMed] [Google Scholar]
- Botchkin LM, Matthews G. Chloride current activated by swelling in retinal pigment epithelium cells. Am J Physiol. 1993;265:C1037–1045. doi: 10.1152/ajpcell.1993.265.4.C1037. [DOI] [PubMed] [Google Scholar]
- Deutman AF. Electro-oculography in families with vitelliform dystrophy of the fovea. Detection of the carrier state. Arch Ophthalmol. 1969;81:305–316. doi: 10.1001/archopht.1969.00990010307001. [DOI] [PubMed] [Google Scholar]
- Edelman JL, Lin H, Miller SS. Acidification stimulates chloride and fluid absorption across frog retinal pigment epithelium. Am J Physiol. 1994a;266:C946–956. doi: 10.1152/ajpcell.1994.266.4.C946. [DOI] [PubMed] [Google Scholar]
- Edelman JL, Lin H, Miller SS. Potassium-induced chloride secretion across the frog retinal pigment epithelium. Am J Physiol. 1994b;266:C957–966. doi: 10.1152/ajpcell.1994.266.4.C957. [DOI] [PubMed] [Google Scholar]
- Edelman JL, Miller SS. Epinephrine stimulates fluid absorption across bovine retinal pigment epithelium. Invest Ophthalmol Vis Sci. 1991;32:3033–3040. [PubMed] [Google Scholar]
- Frace AM, Mery P-F, Fischmeister R, Hartzell HC. Rate-limiting steps in the β-adrenergic stimulation of cardiac calcium current. J Gen Physiol. 1993;101:337–353. doi: 10.1085/jgp.101.3.337. [DOI] [PMC free article] [PubMed] [Google Scholar]
- Franciolini F, Nonner W. A multi-ion permeation mechanism in neuronal background chloride channels. J Gen Physiol. 1994;104:725–746. doi: 10.1085/jgp.104.4.725. [DOI] [PMC free article] [PubMed] [Google Scholar]
- Francois J, De Rouck A, Fernandez-Sasso D. Electro-oculography in vitelliform degeneration of the macula. Arch Ophthalmol. 1967;77:726–733. doi: 10.1001/archopht.1967.00980020728003. [DOI] [PubMed] [Google Scholar]
- Fujii S, Gallemore RP, Hughes BA, Steinberg RH. Direct evidence for a basolateral membrane Cl− conductance in toad retinal pigment epithelium. Am J Physiol. 1992;262:C374–383. doi: 10.1152/ajpcell.1992.262.2.C374. [DOI] [PubMed] [Google Scholar]
- Gallemore RP, Hernandez E, Tayyanipour R, Fujii S, Steinberg RH. Basolateral membrane Cl− and K+ conductances of the dark-adapted chick retinal pigment epithelium. J Neurophysiol. 1993;70:1656–1668. doi: 10.1152/jn.1993.70.4.1656. [DOI] [PubMed] [Google Scholar]
- Gallemore RP, Hughes BA, Miller SS. Retinal pigment epithelial transport mechanisms and their contributions to the electroretinogram. Prog Retinal Eye Res. 1997;16:509–566. [Google Scholar]
- Gallemore RP, Hughes BA, Miller SS. In: The Retinal Pigment Epithelium: Function and Disease. Marmor MF, Wolfensberger TJ, editors. New York: Oxford University Press; 1998. pp. 175–198. [Google Scholar]
- Gallemore RP, Steinberg RH. Effects of DIDS on the chick retinal pigment epithelium. I. Membrane potentials, apparent resistances, and mechanisms. J Neurosci. 1989a;9:1968–1976. doi: 10.1523/JNEUROSCI.09-06-01968.1989. [DOI] [PMC free article] [PubMed] [Google Scholar]
- Gallemore RP, Steinberg RH. Effects of DIDS on the chick retinal pigment epithelium. II. Mechanism of the light peak and other responses originating at the basal membrane. J Neurosci. 1989b;9:1977–1984. doi: 10.1523/JNEUROSCI.09-06-01977.1989. [DOI] [PMC free article] [PubMed] [Google Scholar]
- Gallemore RP, Steinberg RH. Light-evoked modulation of basolateral membrane Cl− conductance in chick retinal pigment epithelium: the light peak and fast oscillation. J Neurophysiol. 1993;70:1669–1680. doi: 10.1152/jn.1993.70.4.1669. [DOI] [PubMed] [Google Scholar]
- Gass JDM. Stereoscopic Atlas of Macular Diseases: Diagnosis and Treatment. St Louis: Treatment. C. V. Mosby & Co; 1987. [Google Scholar]
- Hirayama Y, Hartzell HC. Effects of protein phosphatase and kinase inhibitors on Ca2+ and Cl− currents in guinea pig ventricular myocytes. Mol Pharmacol. 1997;52:725–734. doi: 10.1124/mol.52.4.725. [DOI] [PubMed] [Google Scholar]
- Huang B, Karwoski CJ. Light-evoked expansion of subretinal space volume in the retina of the frog. J Neurosci. 1992;12:4243–4252. doi: 10.1523/JNEUROSCI.12-11-04243.1992. [DOI] [PMC free article] [PubMed] [Google Scholar]
- Hughes BA, Miller SS, Farber DB. Adenylate cyclase stimulation alters transport in frog retinal pigment epithelium. Am J Physiol. 1987;252:C385–395. doi: 10.1152/ajpcell.1987.252.4.C385. [DOI] [PubMed] [Google Scholar]
- Hughes BA, Miller SS, Joseph DP, Edelman JL. cAMP stimulates the Na+-K+ pump in frog retinal pigment epithelium. Am J Physiol. 1988;254:C84–98. doi: 10.1152/ajpcell.1988.254.1.C84. [DOI] [PubMed] [Google Scholar]
- Hughes BA, Segawa Y. cAMP-activated chloride currents in amphibian retinal pigment epithelial cells. J Physiol. 1993;466:749–766. [PMC free article] [PubMed] [Google Scholar]
- Jentsch TJ, Stein V, Weinreich F, Zdebik AA. Molecular structure and physiological function of chloride channels. Physiol Rev. 2002;82:503–568. doi: 10.1152/physrev.00029.2001. [DOI] [PubMed] [Google Scholar]
- Joseph D, Miller SS. Apical and basal membrane transport mechanisms in bovine retinal pigment epithelium. J Physiol. 1991;435:439–463. doi: 10.1113/jphysiol.1991.sp018518. [DOI] [PMC free article] [PubMed] [Google Scholar]
- Joseph DP, Miller SS. Alpha-1-adrenergic modulation of K and Cl transport in bovine retinal pigment epithelium. J Gen Physiol. 1992;99:263–290. doi: 10.1085/jgp.99.2.263. [DOI] [PMC free article] [PubMed] [Google Scholar]
- Kenyon E, Maminishkis A, Joseph DP, Miller SS. Apical and basolateral membrane mechanisms that regulate pHi in bovine retinal pigment epithelium. Am J Physiol. 1997;273:C456–472. doi: 10.1152/ajpcell.1997.273.2.C456. [DOI] [PubMed] [Google Scholar]
- Kornak U, Kasper D, Bosl MR, Kaiser E, Schweizer M, Schulz A, Friedrich W, Delling G, Jentsch TJ. Loss of the ClC-7 chloride channel leads to the osteopetrosis in mice and men. Cell. 2001;104:205–215. doi: 10.1016/s0092-8674(01)00206-9. [DOI] [PubMed] [Google Scholar]
- Kuntz CA, Crook RB, Dmitriev A, Steinberg RH. Modification by cyclic adenosine monophosphate of basolateral membrane chloride conductance in chick retinal pigment epithelium. Invest Ophthalmol Vis Sci. 1994;35:422–433. [PubMed] [Google Scholar]
- Kuruma A, Hartzell HC. Bimodal control of a Ca2+ -activated Cl− channel by different Ca2+ signals. J Gen Physiol. 2000;115:59–80. doi: 10.1085/jgp.115.1.59. [DOI] [PMC free article] [PubMed] [Google Scholar]
- LaCour M. Cl− transport in frog retinal pigment epithelium. Exp Eye Res. 1992;54:921–931. doi: 10.1016/0014-4835(92)90156-m. [DOI] [PubMed] [Google Scholar]
- LaVail MM. Outer segment disc shedding and phagocytosis in the outer retina. Trans Ophthalmol Soc UK. 1983;103:397–404. [PubMed] [Google Scholar]
- Lin H, Miller SS. pHi-dependent Cl− HCO3 exchange at the basolateral membrane of frog retinal pigment epithelium. Am J Physiol. 1994;266:C935–945. doi: 10.1152/ajpcell.1994.266.4.C935. [DOI] [PubMed] [Google Scholar]
- Marmor MF, Wolfensberger TJ. In: The Retinal Pigment Epithelium: Function and Disease. Marmor MF, Wolfensberger TJ, editors. New York: Oxford University Press; 1998. p. 776. [Google Scholar]
- Marmorstein AD, Mormorstein LY, Rayborn M, Wang X, Hollyfield JG, Petrukhin K. Bestrophin, the product of the Best vitelliform macular dystrophy gene (VMD2), localizes to the basolateral membrane of the retinal pigment epithelium. Proc Natl Acad Sci U S A. 2000;97:12758–12763. doi: 10.1073/pnas.220402097. [DOI] [PMC free article] [PubMed] [Google Scholar]
- Miller S, Farber D. Cyclic AMP modulation of ion transport across frog retinal pigment epithelium. Measurements in the short-circuit state. J Gen Physiol. 1984;83:853–874. doi: 10.1085/jgp.83.6.853. [DOI] [PMC free article] [PubMed] [Google Scholar]
- Miller SS, Edelman JL. Active ion transport pathways in the bovine retinal pigment epithelium. J Physiol. 1990;424:283–300. doi: 10.1113/jphysiol.1990.sp018067. [DOI] [PMC free article] [PubMed] [Google Scholar]
- Miller SS, Steinberg RH. Active transport of ions across frog retinal pigment epithelium. Exp Eye Res. 1977;25:235–248. doi: 10.1016/0014-4835(77)90090-2. [DOI] [PubMed] [Google Scholar]
- Mohammad-Panah R, Gyomorey K, Rommens J, Choudhury M, Li C, Wang Y, Bear CE. ClC-2 contributes to native chloride secretion by a human intestinal cell line, Caco-2. J Biol Chem. 2001;276:8306–8313. doi: 10.1074/jbc.M006764200. [DOI] [PubMed] [Google Scholar]
- Nehrke K, Arreola J, Nguyen HV, Pilato J, Richardson L, Okunade G, Baggs R, Shull GE, Melvin JE. Loss of hyperpolarization-activated Cl− current in salivary acinar cells from Clcn2 knockout mice. J Biol Chem. 2002;277:23604–23611. doi: 10.1074/jbc.M202900200. [DOI] [PubMed] [Google Scholar]
- Nguyen-Legros J, Hicks D. Renewal of photoreceptor outer segments and their phagocytosis by the retinal pigment epithelium. Intern Rev Cytol. 2000;196:245–313. doi: 10.1016/s0074-7696(00)96006-6. [DOI] [PubMed] [Google Scholar]
- O'Gorman S, Flaherty WA, Fishman GA, Berson EL. Histopathologic findings in Best's vitelliform macular dystrophy. Arch Ophthalmol. 1988;106:1261–1268. doi: 10.1001/archopht.1988.01060140421045. [DOI] [PubMed] [Google Scholar]
- Petrukhin K, Koisti MJ, Bakall B, Li W, Xie G, Marknell T, Sandgren O, Forsman K, Holmgren G, Andreasson S, Vujic M, Bergen AAB, McGarty-Dugan V, Figueroa D, Austin CP, Metzker ML, Caskey CT, Wadelius C. Iddentification of the gene responsible for Best macular dystrophy. Nature Genetics. 1998;19:241–247. doi: 10.1038/915. [DOI] [PubMed] [Google Scholar]
- Qu Z, Hartzell HC. Anion permeation in Ca-activated Cl channels. J Gen Physiol. 2000;116:825–844. doi: 10.1085/jgp.116.6.825. [DOI] [PMC free article] [PubMed] [Google Scholar]
- Qu Z, Hartzell HC. Functional geometry of the permeation pathway of Ca2+ activated Cl− channels inferred from analysis of voltage-dependent block. J Biol Chem. 2001;276:18423–18429. doi: 10.1074/jbc.M101264200. [DOI] [PubMed] [Google Scholar]
- Quinn RH, Quong JN, Miller SS. Adrenergic receptor activated ion transport in human fetal retinal pigment epithelium. Invest Ophthalmol Vis Sci. 2001;42:255–264. [PubMed] [Google Scholar]
- Rodriguez de Turco EB, Gordon WC, Bazan NG. Light stimulates in vivo inositol lipid turnover in frog retinal pigment epithelial cells at the onset of shedding and phagocytosis of photoreceptor membranes. Exp Eye Res. 1992;55:719–725. doi: 10.1016/0014-4835(92)90176-s. [DOI] [PubMed] [Google Scholar]
- Rymer J, Miller SS, Edelman JL. Epinephrine-induced increases in [Ca2+]in and KCl-coupled fluid absorption in bovine RPE. Invest Ophthalmol Vis Sci. 2001;42:1921–1929. [PubMed] [Google Scholar]
- Schultz BD, Singh AK, Devor DC, Bridges RJ. Pharmacology of CFTR chloride channel activity. Physiol Rev. 1999;79(suppl 1):S109–S144. doi: 10.1152/physrev.1999.79.1.S109. [DOI] [PubMed] [Google Scholar]
- Stobrawa SM, Breiderhoff T, Takamori S, Engel D, Schweizer M, Zdebik AA, Bosl MR, Ruether K, Jahn H, Draguhn A, Jahn R, Jentsch TJ. Disruption of ClC-3, a chloride channel expressed on synaptic vesicles, leads to a loss of the hippocampus. Nueron. 2001;29:185–196. doi: 10.1016/s0896-6273(01)00189-1. [DOI] [PubMed] [Google Scholar]
- Strauss O, Steinhausen K, Mergler S, Stumpff F, Wiederholt M. Involvement of protein tyrosine kinase in the InsP3-induced activation of Ca2+-dependent Cl− currents in cultured cells of the rat retinal pigment epithelium. J Memb Biol. 1999;169:141–153. doi: 10.1007/s002329900526. [DOI] [PubMed] [Google Scholar]
- Strauss O, Wiederholt M, Wienrich M. Activation of Cl− currents in cultured rat retinal pigment epithelial cells by intracellular applications of inositol-1, 4, 5-triphosphate: differences between rats with retinal dystrophy (RCS) and normal rats. J Memb Biol. 1996;151:189–200. doi: 10.1007/s002329900069. [DOI] [PubMed] [Google Scholar]
- Sun H, Tsunenari T, Yau K-W, Nathans J. The vitelliform macular dystrophy protein defines a new family of chloride channels. Proc Natl Acad Sci U S A. 2002;99:4008–4013. doi: 10.1073/pnas.052692999. [DOI] [PMC free article] [PubMed] [Google Scholar]
- Tsuboi S, Pederson JE. Volume transport across the isolated retinal pigment epithelium of cynomolgus monkey eyes. Invest Ophthalmol Vis Sci. 1988;29:1652–1655. [PubMed] [Google Scholar]
- Uebersax ED, Grindstaff RD, Defoe D. Survival of the retinal pigment epithelium in vitro: comparison of freshly isolated and subcultured cells. Exp Eye Res. 2000;70:381–390. doi: 10.1006/exer.1999.0802. [DOI] [PubMed] [Google Scholar]
- Ueda Y, Steinberg RH. Chloride currents in freshly isolated rat retinal pigment epithelial cells. Exp Eye Res. 1994;58:331–342. doi: 10.1006/exer.1994.1023. [DOI] [PubMed] [Google Scholar]
- Weng TX, Godley BF, Jin GF, Mangini NJ, Kennedy BG, Yu AsL, Wills NK. Oxidant and antioxidant modulation of chloride channels expressed in human retinal pigment epithelium. Am J Physiol. 2002;283:C839–849. doi: 10.1152/ajpcell.00445.2001. [DOI] [PubMed] [Google Scholar]
- Wills NK, Weng T, Mo L, Hellmich HL, Yu A, Wang T, Buchheit S, Godley BF. Chloride channel expression in cultured human fetal RPE cells: response to oxidative stress. Invest Ophthalmol Vis Sci. 2000;41:4247–4255. [PubMed] [Google Scholar]


