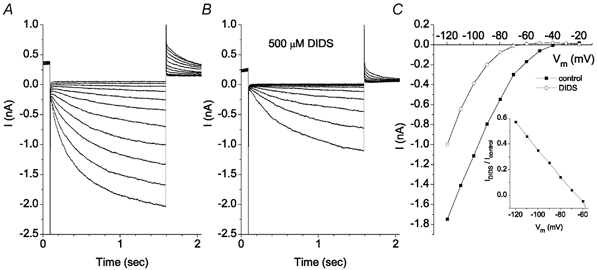
Figure 7. ICl,ir is blocked by DIDS in a voltage-dependent manner.

Voltage protocol as in Fig. 3. Solutions contained 10 μm Gd3+. A, control traces. B, traces recorded in the presence of 0.5 mm DIDS. C, current-voltage curves in the control solution (▪) and in 0.5 mm DIDS (○). Inset: the fraction of current not blocked by DIDS is plotted vs. membrane potential. This experiment is typical of 3 cells.
