
Figure 9. Effect of Zn2+ on currents in cells recorded with high and low cytoplasmic [Ca2+].
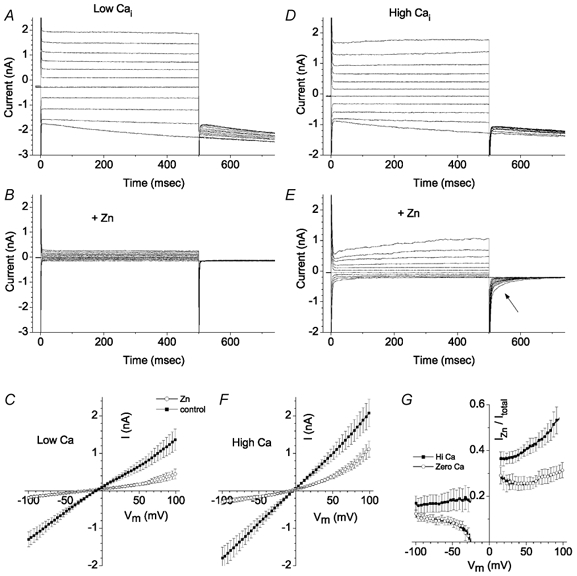
A-C, < 20 nm[Ca2+]i. D-F, 10 μm[Ca2+]i. Currents were recorded in control Ringer solution (A and D) and then 1 mm ZnCl2 was added (B and E). In E note the deactivating tail current (arrow). C and F, average (n = 8) current-voltage relationships for cells with < 20 nm[Ca2+]i (n = 7) (C) and 10 μm[Ca2+]i (F). Current-voltage relationships were determined from a voltage ramp protocol consisting of a 225 ms pulse to −100 mV followed by a 1 s ramp to 100 mV. G, fraction of Zn2+-insensitive current. The ratio of currents in the absence and presence of 1 mm Zn2+ (from C and F) was calculated at each potential. between −20 and +20 mV the values are blanked because the signal-to-noise ratio of the currents was too large to calculate a reliable ratio.