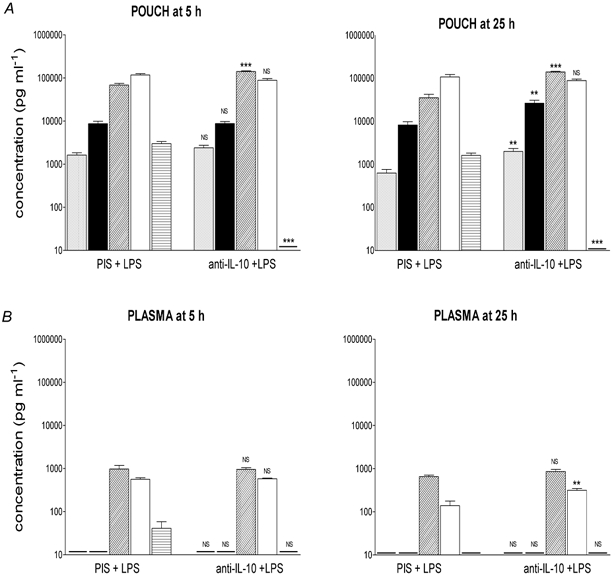
Figure 4. Effect of treatment with anti-IL-10 serum on LPS-induced cytokine production.

Concentrations of immunoreactive TNF-α (grey columns), IL-1β (black columns), IL-6 (diagonal hatched columns), IL-1ra (open columns) and IL-10 (horizontal hatched columns) at the site of injection (pouch, A) and in the plasma (B), 5 and 25 h after injection (i.po.) of PIS + LPS (100 μg kg−1) or anti-IL-10 + LPS. Data are expressed as means ±s.e.m., n = 5. - indicates value below the detection limit of the assay. NS, not significant; **P < 0.01, ***P < 0.001; PIS + LPS vs. anti-IL-10 + LPS, ANOVA (Tukey post hoc test).
