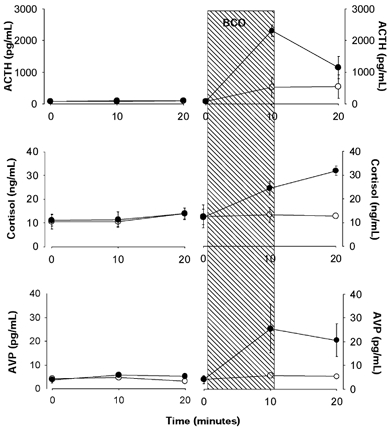
Figure 2. Fetal plasma concentrations of adrenocorticotropin, cortisol and arginine vasopressin.

Top panels, adrenocorticotropin (ACTH); middle panels, cortisol; and bottom panels, arginine vasopressin (AVP). Oestradiol-treated groups are represented by filled symbols and placebo-treated groups are represented by open symbols. The 10 min period of brachiocephalic occlusion (BCO) is represented by the hatched area. Data are presented as means ±s.e.m.
