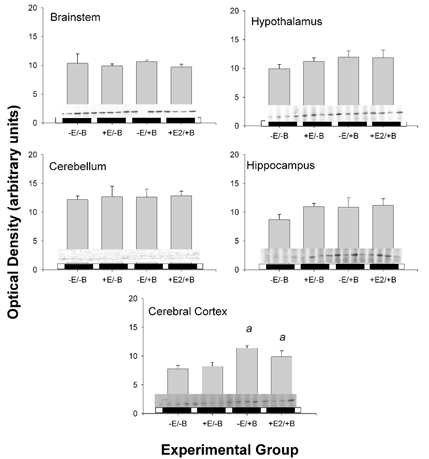
Figure 5. Changes in PGHS-1 protein abundance in five brain regions.

Data are presented as means ±s.e.m. Western blots are reproduced above horizontal bars delimiting the experimental groups, in the order represented on the x- axis (n = 4 per group). Statistically significant main effect of BCO is represented by a.
