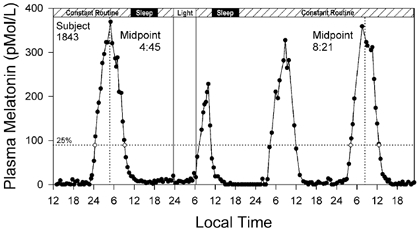
Figure 2. The melatonin profile from the pre-stimulus to the post-stimulus CRs.

Plasma melatonin on the vertical axis is plotted against local time on the horizontal axis for subject 1843 in Fig. 1. The protocol procedure is indicated on the bar at the top of the figure. The 25 % threshold (89.5 pmol l−1, dotted horizontal line) of the peak amplitude of the fitted 3-harmonic curve from the pre-stimulus CR was used to calculate the pre- and post-stimulus DLMOn and DLMOff values (⋄). The midpoints between DLMOn and DLMOff used to calculate the light-induced phase delay for this subject (04:45 h to 08:21 h = −3.60 h) are indicated by the vertical dotted lines. Note suppression of the second melatonin peak in the figure during the light exposure.
