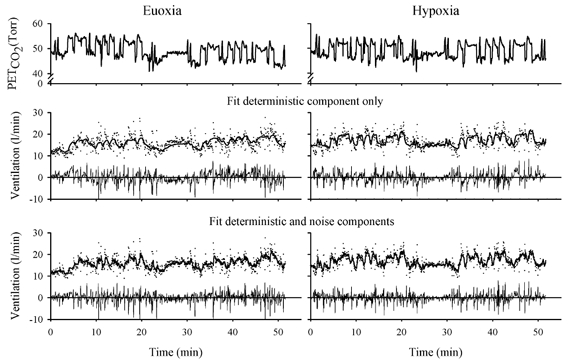
Figure 1. Example of data and model fits for a bilaterally carotid body-resected subject under conditions of euoxia (left) and hypoxia (right).

The top panel shows the multifrequency binary sequence (MFBS) in PET,CO2. The two other panels show the ventilation data and model fits. Dots represent ventilation data and lines represent the model output; residuals are shown below each fit. The middle panel shows just the deterministic component of the model fit, i.e. the component that arises directly from the input stimulus. The model follows the pattern of variations in ventilation but the residuals remain correlated with many successive residuals being either all positive or all negative. The bottom panel shows the entire model fit. This includes the noise model, which models the intrinsic correlation between breaths. In this case the residuals are much less correlated, with no long runs of successive residuals being either all positive or all negative.
