
Figure 1. Green autofluorescence of cerebral slices in blue light.
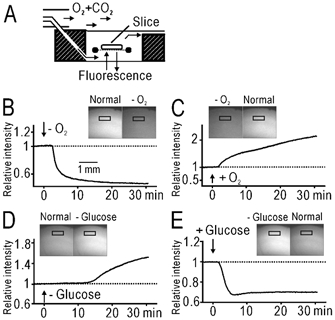
A, the recording chamber. B, basal autofluorescence before and during application of O2-free (–O2) medium. Insets are fluorescence images of the slice in arbitrary grey units. The time course of relative fluorescence intensity in the window placed in layer II/III is shown. The intensity was normalized by the value before the application of the O2-free medium. C, recovery of the autofluorescence after application of normal medium in the same slice shown in B. D, E, autofluorescence before and during application of glucose-free (–glucose) medium (D) and the recovery in the same slice (E).