
Figure 6. Comparison of autofluorescence responses and changes in light reflection.
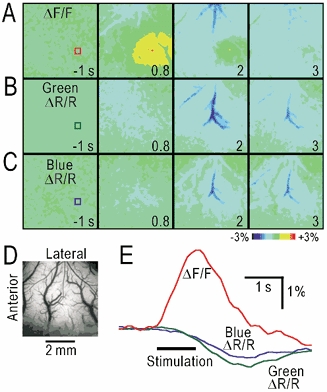
A, autofluorescence responses elicited by the stimulation. B, C, changes in the green (B) and blue (C) light reflection (ΔR/R). D, original brain surface image in the same rat. E, time course of ΔF/F and ΔR/R in the windows in A–C. The colours of the traces correspond to those in the windows.