
Figure 2. Effect of intracellular hyperosmotic pressure on activation, C-type inactivation and deactivation in Kv1.4ΔN channels.
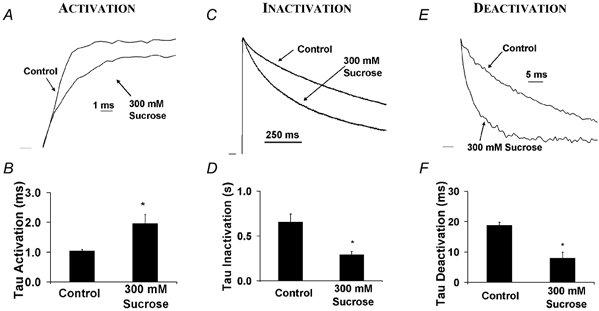
Currents were recorded from detached inside-out giant patches (Hilgemann, 1990) perfused with 300 mm (330 mosmol l−1) sucrose to increase osmotic pressure. Currents are normalized (and inverted where necessary) to emphasize changes in kinetic rates. Voltage clamp pulses (duration 1 s were applied from −90 to +50 mV. A, activation was slowed in the presence of an intracellular hyperosmotic solution. B, the activation time constant (τ) increased from 1.04 ± 0.05 ms in control to 1.96 ± 0.31 ms in hyperosmotic solution (n = 5, P < 0.01). C, the rate of C-type inactivation increased in intracellular hyperosmotic solution. D, the C-type inactivation time constant decreased from 0.66 ± 0.09 s in control to 0.29 ± 0.04 s in hyperosmotic solution (n = 5, P < 0.01). E, deactivation increased with intracellular hyperosmotic exposure. F, the fast time constant of deactivation decreased from 18.8 ± 0.94 ms in control to 8.01 ± 1.92 ms in hyperosmotic solution (n = 5, P < 0.01). Peak current was also suppressed by application of hyperosmotic pressure (see volume calculations). Peak current was 3.22 μA in control and 1.69 μA in 300 mm sucrose. Peak currents elicited in hyperosmotic solutions were 51 ± 6 % (at +50 mV) 46 ± 5 % (+40 mV) and 43 ± 6 % (+30 mV) of control (n = 5).