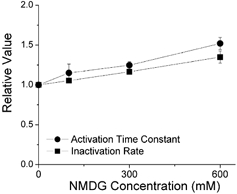
Figure 3. The effects of osmotic pressure were related to the osmolyte concentration.

The cut-open oocyte voltage clamp technique was used to apply concentrations of NMDG between 0 and 600 mm, and determine the time constants of activation and inactivation. The oocyte was stepped from −90 to +30 mV for 5 s in 0, 100, 300 and 600 mm NMDG (n = 3). Activation and C-type inactivation rates are normalized to enable direct comparison.
