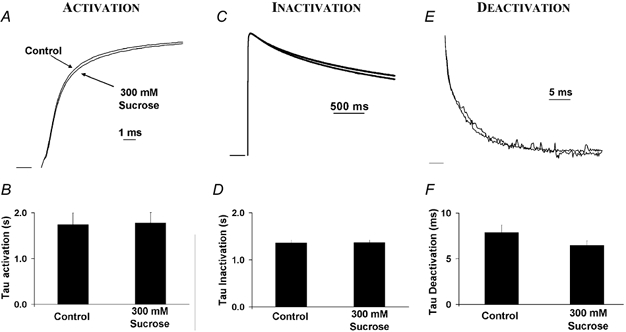
Figure 4. Effect of extracellular osmotic pressure on activation, C-type inactivation and deactivation measured using the cut-open oocyte voltage clamp technique.

The hyperosmotic extracellular solution contained 300 mm sucrose, giving an increase in osmotic pressure of 330 mosmol l−1. The membrane was stepped from −90 to +50 mV for 1 s. Similar negative results were observed when NMDG was used as the extracellular osmolyte (results not shown). A, external hyperosmotic pressure had no effect on activation. B, the average time constant of activation was unchanged: τactivation = 1.74 ± 0.26 ms in control; τactivation = 1.78 ± 0.23 ms in hyperosmotic solution (n = 12, P > 0.05). C, extracellular hyperosmotic exposure had no effect on C-type inactivation. D, the average time constant of inactivation was unchanged: τinactivation = 1.36 ± 0.06 s in control; τinactivation = 1.37 ± 0.06 s in hyperosmotic solution (n = 12, P > 0.05) E, external hyperosmotic solution had a very small effect on deactivation. F, the time constant of deactivation decreased: τdeactivation = 7.86 ± 0.83 ms in control; τdeactivation = 6.46 ± 0.50 ms in hyperosmotic solution (n = 11, P < 0.01).
