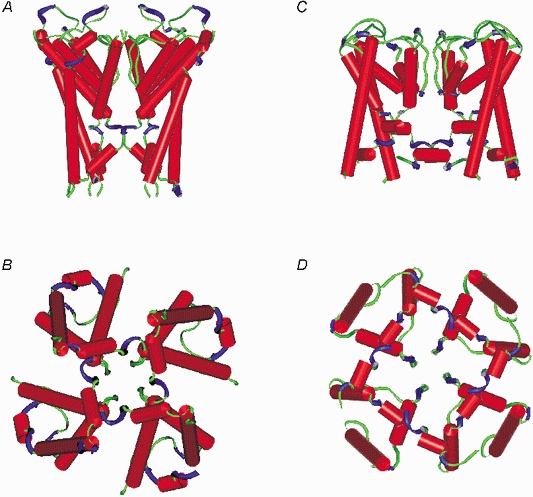
Figure 6. We used manual measurement of the KcsA and MthK intracellular pore dimensions and geometry to estimate the maximum water-filled volume of the entire permeation pathway.

A and B, side and bottom views of the open KcsA channel (Doyle et al. 1998; Perozo et al. 1999). C and D, side and bottom views of the open MthK channel (Jiang et al. 2002).
