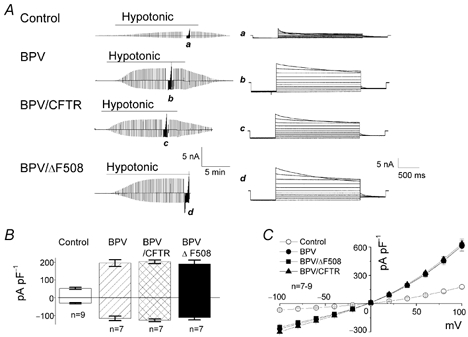
Figure 1. Effects of BPV transfection on whole-cell VSOR Cl− currents in C127 cells.

A, representative records for control (top panel), BPV (second panel), BPV/CFTR (third panel) and BPV/ΔF508 cells (bottom panel) before, during and after a hypotonic challenge. Alternating pulses from 0 to ±40 mV or step pulses from −100 to +100 mV in 20 mV increments (at a–d) were applied. Expanded traces of current responses to step pulses (a–d) are shown on the right. B, mean VSOR current densities recorded at ±40 mV in control, BPV, BPV/CFTR and BPV/ΔF508 cells after osmotic swelling under hypotonic conditions. The currents recorded from the three different BPV-transfected cells are significantly larger than that from the control. C, current–voltage relationships for instantaneous VSOR currents. Each symbol represents the mean instantaneous current density ± s.e.m. of 9, 7, 7 and 7 observations in control, BPV, BPV/CFTR and BPV/ΔF508 cells, respectively, under hypotonic conditions.
