
Figure 2. Effects of BPV transfection on single VSOR Cl− channel conductance in C127 cells.
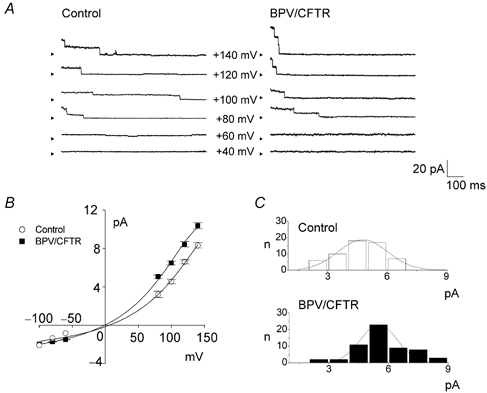
A, representative single-channel recordings from cell-attached patches on control (left panel) and BPV/CFTR cells (right panel), taken during application of step pulses (applied immediately before traces) from a holding potential of −140 mV to the indicated potentials (−Vp, where Vp is pipette potential). The number of active channels contained in a patch was 2.9 ± 0.4 and 3.8 ± 0.5 in control and BPV/CFTR cells, respectively. Arrowheads represent the zero current level. B, current–voltage relationships for the single-channel currents of control (○, n = 3–20) and BPV/CFTR cells (▪, n = 3–16). C, amplitude histogram plots for single-channel currents recorded at +100 mV from 58 control (upper panel) and 58 BPV/CFTR cells (lower panel) with s.d. values of 1.3 and 0.9, respectively.