
Figure 3. Effects of BPV transfection on osmotic water permeability and volume expansion sensitivity of whole-cell VSOR Cl− currents in C127 cells.
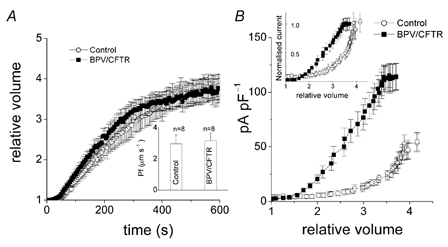
A, osmotic swelling rates in control (○, n = 8) and BPV/CFTR cells (▪, n = 8) under the whole-cell configuration. Cell volume was normalised to the volume before a hypotonic challenge. Osmotic water permeability (Pf) was calculated using eqn (1) and is summarised in the inset. B, whole-cell VSOR Cl− current densities in control (○, n = 8) and BPV/CFTR cells (▪, n = 8) plotted as a function of relative cell volume, which was monitored simultaneously during recordings. The inset shows the normalised current plotted against relative cell volume.