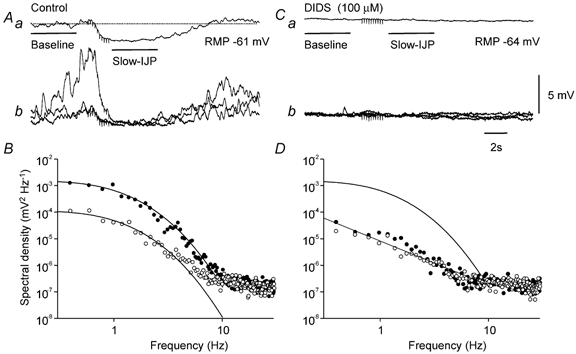
Figure 2. Effect of DIDS on nitrergic-IJPs and discharge of membrane noise in the circular layer of guinea-pig antrum.

The upper left trace (Aa) shows a nitrergic-IJP, evoked by a train of stimuli (10 impulses at 5 Hz) at resting potential −61 mV, with an amplitude of 2.2 mV. Three of the individual traces that made up the averaged nitrergic-IJP are shown superimposed below (Ab). Baseline (•) and nitrergic-IJP (○)regions of these traces were used to calculate the power spectral density curves shown in B. Each power spectral curve was adequately fitted using time constants A and B of 515 ms and 60 ms, respectively. The upper right trace (Ba) shows the average response, evoked by a train of stimuli (10 impulses at 5 Hz) in the presence of DIDS (100 μM). DIDS caused a baseline membrane potential hyperpolarization of 4 mV and abolished the nitrergic-IJP. Three of the individual traces, which made up the averaged response in DIDS are shown below (Bb). Baseline (•) and nitrergic-IJP (○)regions of these traces were used to calculate the power spectral density curves shown in D. Note that the residual low frequency power detected in DIDS was abolished by nitrergic nerve stimulation. Also shown in D, for comparison, is the control theoretical spectral density curve shown in A, determined before the addition of DIDS. Nifedipine (1 μM), atropine (1 μM) and apamin (0.1 μM) were present throughout.
