
Figure 3. Effect of changing membrane potential on nitrergic-IJPs recorded from the circular layer of guinea-pig antrum.
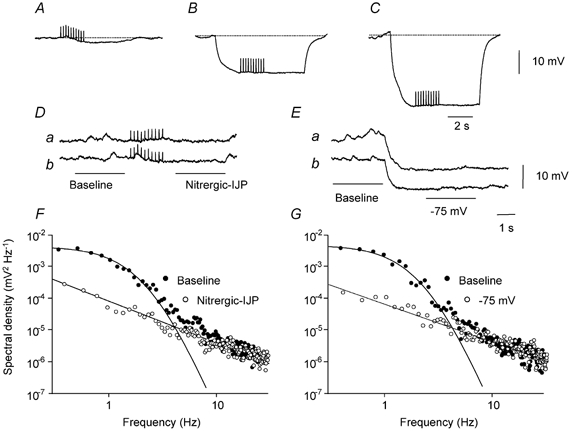
The upper three traces show a nitrergic-IJP, evoked by a train of stimuli (10 impulses at 5 Hz) at resting potential, −61 mV, with an amplitude of 2.7 mV (A), during a hyperpolarizing current pulse, 2 nA (B) and during a hyperpolarizing current pulse, 4 nA (C): each trace is an average of 10 successive trials. Two of the individual traces, which made up the averaged nitrergic-IJP are shown below (Da and b). Baseline (•) and nitrergic-IJP (○) regions of these traces were used to calculate the power spectral density curves shown in F. Power at low frequencies was not detected during the nitrergic-IJP. The middle right traces (Ea and b) show two of the traces used to calculate the power spectral curves at −61 mV and at −75 mV shown in G. Note that at a membrane potential of −75 mV, power at low frequencies was absent. Nifedipine (1 μM), atropine (1 μM) and apamin (0.1 μM) were present throughout.