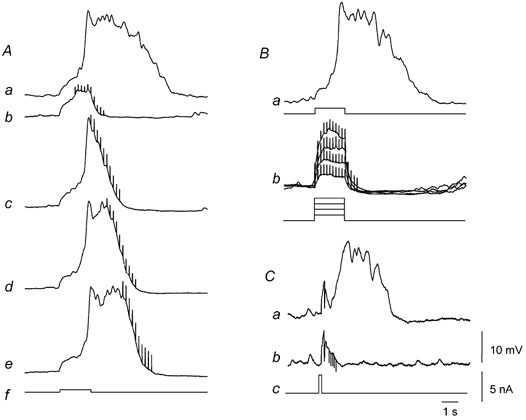
Figure 4. Inhibition of regenerative responses by nitrergic nerve stimulation in the circular layer of guinea-pig antrum.

The family of traces shown on the left-hand side of the figure (Aa-f) illustrate the effect of nitrergic nerve stimulation on regenerative potentials. A regenerative potential (Aa) was evoked by a depolarizing current pulse (Af). The regenerative potential was abolished when a train of stimuli (10 impulses at 5 Hz) was applied during the depolarizing current (Ab). The duration of the regenerative potential was reduced when the same train of stimuli was applied at progressively later times during the regenerative potential (Ac-e). The same current pulse (Af) was applied on each occasion. The resting membrane potential was −62 mV. The upper right trace (Ba) shows a regenerative potential initiated by a threshold depolarization at resting potential, −69 mV. The lower trace (Bb) shows that increasing the amplitude of the depolarizing pulse did not overcome the inhibition produced by nitrergic nerve stimulation. The lower right trace (Ca) shows a regenerative potential initiated by a brief depolarizing pulse (Cc) at resting potential, −62 mV. The lower trace (Cb) shows that a brief train of stimuli (five impulses at 10 Hz) presented during the latent period inhibited the subsequent generation of a regenerative potential. Time, voltage and current calibration bars apply to all recordings. Nifedipine (1 μM), atropine (1 μM) and apamin (0.1 μM) were present throughout.
