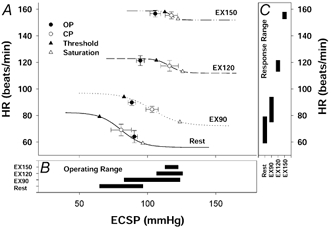
Figure 1.

A, carotid-HR (cardiac) stimulus-response curves at rest and during mild (EX90), moderate (EX120) and heavy (EX150) exercise. Lines represent mean data fitted to the logistic function model. Symbols denote actual group data (means ±s.e.m.); OP, pre-stimulus operating point; CP, centring point; Threshold, carotid sinus threshold pressure; Saturation, carotid sinus saturation pressure; ECSP, estimated carotid sinus pressure. B, operating range of the carotid-HR stimulus-response curve derived from the logistic function model. C, response range (A1) of the carotid-HR stimulus-response curve derived from the logistic function model. The HR response curves were reset upward and rightward during exercise without a change in sensitivity. Although carotid sinus threshold pressure was augmented with the increasing exercise intensity, carotid sinus saturation pressure was not significantly increased during moderate and heavy exercise compared with mild exercise. Thus, the operating and response ranges of the carotid-HR baroreflex function curves were decreased during moderate and heavy exercise.
