
Figure 3.
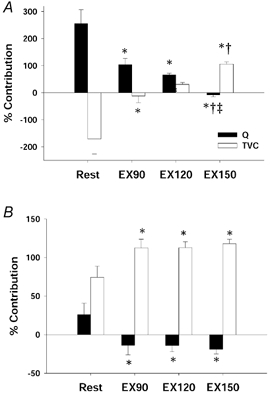
Percentage contribution of cardiac output (Q) and total vascular conductance (TVC) to the CBR-mediated changes in MAP at the time of the peak HR response (A) and at the time of the peak MAP response (B) at rest and during mild (EX90), moderate (EX120) and heavy (EX150) exercise. Bars represent the average contribution of all NP and NS stimuli for all subjects (means ±s.e.m.). *Different from Rest (P < 0.05); †different from EX90 (P < 0.05); ‡different from EX120 (P < 0.05). As exercise intensity increased, the contribution of Q progressively decreased at the time of the peak HR response. Similarly, at the time of the peak MAP response, the small contribution of Q seen at rest was completely eliminated with even mild exercise. The contribution of TVC at the time of both the peak HR response and the peak MAP response increased with exercise.