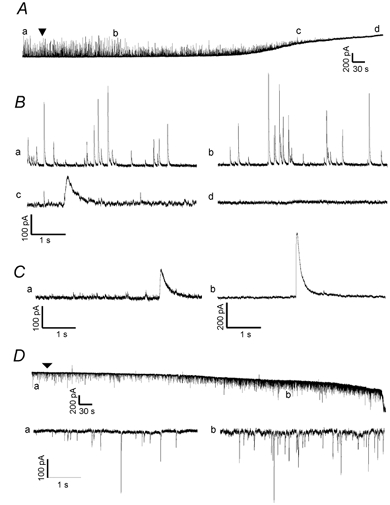
Figure 6. The giant slow inward current does not appear in low [Cl−] solutions.

A, continuous recording of the time course of effects of bath-applied MeHg (100 μM) on spontaneous currents recorded from a representative Purkinje cell in slice at a holding potential of 0 mV with low Cl−-containing pipette solution (140 mM caesium gluconate). Note, the arrowhead indicates the starting point of MeHg exposure. The lower case letters (a-d) indicate specific noteworthy changes in spontaneous events after MeHg exposure. B, portions of the traces from the same sampling points indicated in A are shown on an expanded time scale: a, control; b, MeHg-induced changes in amplitude and frequency of spontaneous currents; c, MeHg-induced giant slow outward currents and induction of the slow tonic current, which is now outward at this holding potential; d, complete block of all spontaneous events, but continuation of the tonic slow current. C, two examples demonstrate specifically the presence of MeHg-induced giant slow outward currents in two other Purkinje cells with low [Cl−] pipette solution at different holding potentials and with different MeHg concentrations. Ca, a giant slow outward response recorded from a Purkinje cell at a holding potential of 0 mV at 25 min after exposure to 20 μM MeHg. Cb, a giant slow outward current recorded from another Purkinje cell at +60 mV after exposure to 100 μM MeHg for 12 min. D, continuous recording of the time course of effects of MeHg (100 μM) on spontaneous currents recorded from a Purkinje cell in another slice at a holding potential of −70 mV using the low Cl−-containing pipette solution. The lower case labels (a, b) again indicate the amplitude and frequency of spontaneous events before (a) and after (b)14 min of MeHg exposure. In B, the portions of the same sampling points indicated in D are shown on an expanded time scale: a, control; b, MeHg-induced initial increases in amplitude and frequency of the spontaneous currents. The arrowhead indicates the starting point of MeHg exposure. Note that now in response to MeHg no slow giant currents are seen, although large amplitude rapid mIPSCs still occur, as do the increases in mean frequency and amplitude of mIPSCs and the tonic slowly developing current. Each trace is a representative depiction of 4–6 individual experiments.
