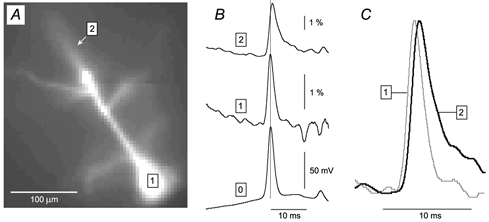
Figure 2. Voltage imaging of AP backpropagation.

A, microphotograph of a neocortical pyramidal layer V neuron loaded with the fluorescent voltage-sensitive dye JPW3028. The neuron was stimulated by direct current injection to produce a single AP, and subjected to simultaneous whole-cell and multi-site optical measurements (temporal average of 4 trials). B, whole-cell record (trace 0) is aligned with optical signals from the soma (trace 1) and apical dendrite (trace 2 – arrow in A). The thin vertical line marks the peak of the somatic spike. C, optical traces from the soma (grey) and apical dendrite 240 μm from the soma (black) are scaled and superimposed for direct comparison of the timing and shape of the signals. In this and the following figures the upward deflection (positive signal) represents an increase in the fluorescence intensity, and the amplitude is expressed as ΔF/F.
