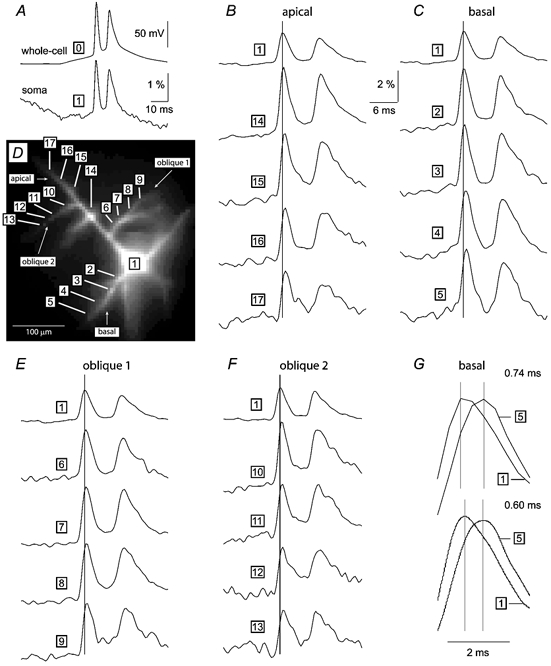
Figure 3. Simultaneous multi-site optical imaging of membrane potential transients from basal, oblique and apical dendrites.

A layer V pyramidal neuron (D) was loaded with fluorescent voltage-sensitive dye, and injected with a current pulse to produce 2 APs. A, the somatic whole-cell record (trace 0) is aligned with the somatic optical signal (trace 1) to show the agreement in respect to timing, time course and relative amplitude of 2 spikes. B, C, E and F each consist of the somatic optical signal (trace 1) aligned with 4 optical signals recorded along apical (A), basal (C) and 2 oblique dendrites (E and F), as indicated by numbers on the microphotograph shown in D. Optical signals are products of: (1) spike-triggered temporal averaging (4 trials); (2) spatial averaging (n = 6–9 neighbouring pixels); and (3) digital filtering (Gaussian low-pass 0.5 kHz). The vertical line marks the peak of the first somatic spike. G, upper, AP-associated optical signal in the basal dendrite 145 μm from the soma (trace 5) is scaled and superimposed on the somatic optical signal (trace 1), to show the propagation latency on a faster time scale. Lower, same two traces as above, but interpolated with sinc function. The corresponding interspike interval, measured as the time difference between two samples of maximum amplitude (marked by vertical lines), is displayed above each trace pair. For multiple-frame and movie presentation of these experimental data see ‘Supplementary material’.
