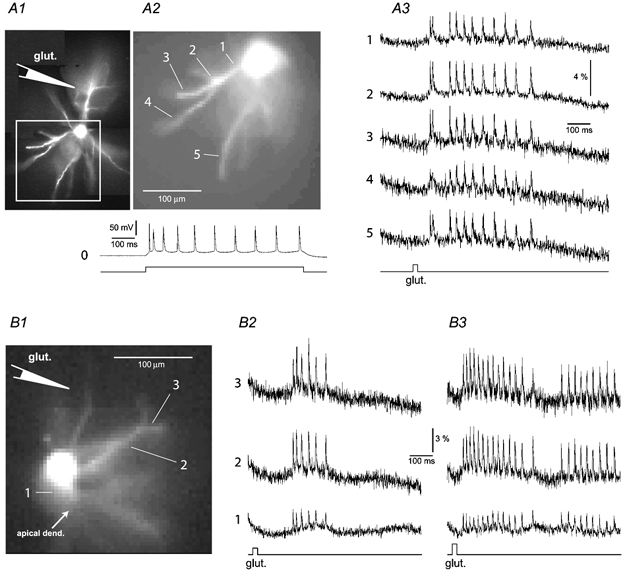
Figure 9. Frequency-independent AP backpropagation in basal dendrites – two examples.

A1, composite high spatial resolution fluorescence image (520 nm) of a pyramidal neuron filled with the voltage-sensitive dye. During the filling procedure a depolarizing current pulse (duration = 700 ms) was injected to produce a burst of APs (trace 0). The loading pipette was then pulled out (outside-out patch) and a glutamate-filled sharp pipette was placed in the position indicated by the schematic drawing. A2, low spatial resolution fluorescence image (80 pixels × 80 pixels) of the area marked by a rectangle in A1, taken with the NeuroCCD camera. A3, glutamate-evoked APs recorded optically from 5 ROI located on the soma-dendrite junction (1), and along primary (2) and secondary (3–5) basal branches. Note that ROI ‘4’ is ∼80 μm beyond the branch point. The timing and duration (20 ms) of the glutamate pulse are indicated below. The experiment was performed at 29 °C bath temperature. B1, frame selected from the sequence of frames captured by the data acquisition camera during the voltage-sensitive dye imaging of glutamate-evoked APs. The apical dendrite is out of focus and oriented down and right. Schematic drawing indicates the relative position of the glutamate-filled stimulation electrode. B2, optical signals from the cell body, and 2 ROI along the basal dendrite (as indicated in B1), 85 and 130 μm from the centre of the soma. B3, same as in B2, except the intensity of the iontophoretic current was adjusted to evoke a 40 Hz somatic firing rate. Note that the amplitude of the optically recorded AP signal is relatively stable throughout the burst. The experiment was performed at 33 °C. Each optical trace in this figure is an averaged output of 16 neighbouring pixels (4 pixels × 4 pixels). There was no temporal averaging.
