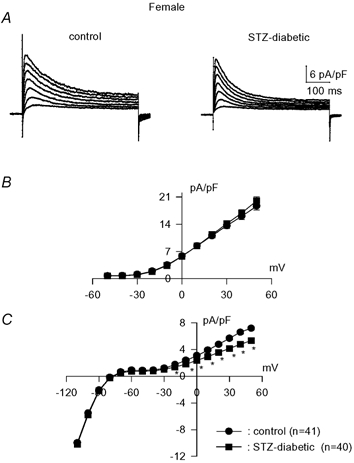
Figure 1. Effects of STZ-induced diabetes on K+ currents in myocytes from female rats.

A, sample current traces obtained in response to 500 ms pulses from −80 mV to potentials in the range −10 to +50 mV in myocytes from untreated (left) and STZ-induced diabetic (right) females. B, mean (± s.e.m.) peak current densities plotted against membrane potentials obtained from control (n = 41, •) and diabetic (n = 40, ▪) rat cells. C, mean sustained current densities (measured at end of 500 ms pulses) from the same groups of cells, plotted against membrane potential. * Significant difference (P < 0.01 to P < 0.0001) in currents between −30 and +50 mV.
