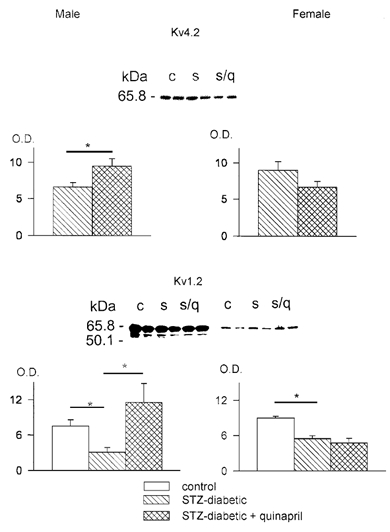
Figure 4. Western blots obtained in membrane extracts from female hearts.

Top panel, blot obtained with an antibody directed against the channel protein Kv4.2 Two lanes each are shown from control (c), STZ-induced diabetic (s) and diabetic with quinapril (s/q) after 8 h perfusion. Below, summary data obtained by densitometry. Mean (± s.e.m.) optical density (O.D.) values are shown, normalized to bands in Coomassie blue gel stains (see Methods). On the left are results in males (blots shown in Shimon & Liu, 2003), in the absence of ( , n = 13) and following perfusion with quinapril (
 , n = 12). The increase in densitometry (P < 0.03) parallels the increase in Ipeak in males. On the right are the values obtained in females, showing no significant differences in the absence of (n = 4) or following perfusion with quinapril (n = 4), paralleling the lack of change in Ipeak. Bottom panel, blot obtained using an antibody against Kv1.2. The same samples as above were used. In addition, six lanes are shown (right) in which a competing peptide for Kv1.2 was used. The peptide blocked the lower of the two bands shown, which was the band measured by densitometry. The mean data in control (□), diabetic (
 ) and diabetic hearts perfused with quinapril (
 ) are shown (left) for males (blots shown in Shimon & Liu, 2003) and females (right). * Significant reduction (P < 0.02) in Kv1.2 expression in both panels in the diabetic hearts (n = 5 in males, n = 4 in females), but augmentation of channel protein was only seen in males (P < 0.02, n = 6), with no effect in females (n = 4).
