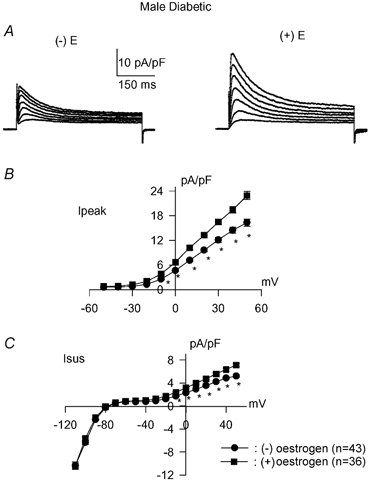
Figure 9. Effects of oestradiol in myocytes from diabetic males.

A, sample current traces (same voltage protocol as Fig. 1) from diabetic male rat myocytes in the absence (left, (−)E) or following (right (+)E) 6 h exposure to 100 nM 17β-oestradiol. B, current–voltage relationship for peak currents in the absence (•, n = 43 cells) or following administration of 17β-oestradiol (▪, n = 36). * Significant increase in Ipeak by oestradiol (P < 0.002 to P < 0.0008) between −40 and +50 mV. C, steady-state current–voltage relationship obtained in the same cells as in B. * Significant increase in Isus by oestradiol (P < 0.04 to P < 0.0001) between −60 and +50 mV.
