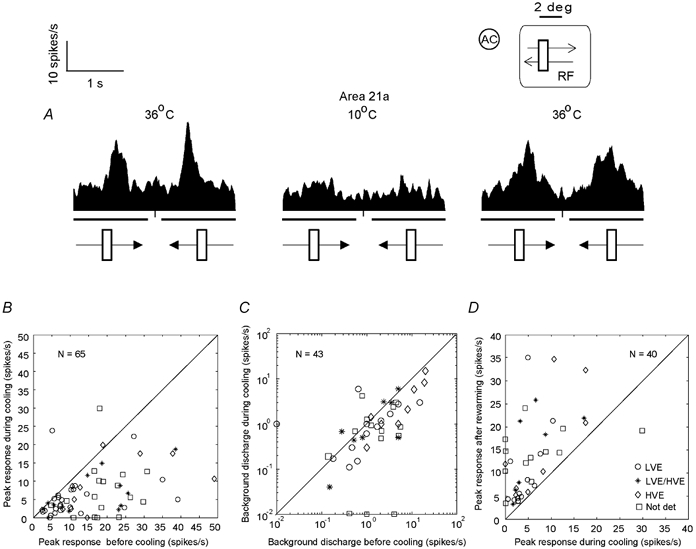
Figure 3. Effects of reversible inactivation of area 21a on the magnitude of responses and background (spontaneous) activity of collicular neurones.

A, peristimulus time histograms (PSTHs) constructed on the basis of responses of a collicular neurone to visual stimuli before and during inactivation (by cooling) of area 21a as well as after rewarming area 21a. Each PSTH was constructed on the basis of responses to 10 presentations of a 2.7 × 0.9 deg light bar moving across the cell's RF at 5 deg s−1 parallel to the horizontal meridian. The heavy lines below the abscissae indicate the periods when the stimuli moved across the RF. The directions of movement are indicated by the arrowed bars at the bottom of the PSTHs. The inset in the upper righthand corner indicates location (in relation to the area centralis, AC) and size of the cell's RF. The length of the visual stimulus in relation to the size of the cell's RF is also indicated. Note that during cooling of the Peltier probe located over area 21a to 10 °C the cell displayed a substantial (71 %) decrease in the magnitude of response and that rewarming of area 21a resulted in a substantial (60 %) recovery of the response. B, peak discharge rates of our sample of collicular neurones during inactivation of area 21a vs. those before inactivation of area 21a. Overall, for the whole sample there was a significant drop (P < 0.0001; Mann–Whitney U test) in the magnitude of responses during cortical inactivation. C, background discharge rates of collicular neurones during inactivation of area 21a vs. background discharge rates of collicular neurones before inactivation of area 21a. For graphical purposes 0.01 spikes s−1 were added to the cells which showed zero background activity. The values are plotted only for those cells in which inactivation of area 21a resulted in significant changes in the magnitude of responses. For this sample the mean background activity was 3.36 ± 4.66 spikes s−1 (range 0.01-20 spikes s−1). During cooling of area 21a, the mean background activity of the sample decreased to 1.96 ± 2.82 spikes s−1; (range 0.01-15 spikes s−1). This effect was not significant (P = 0.06; Mann-Whiney U test). D, peak discharge rates of responses of collicular neurones after rewarming of area 21a vs. those during cooling. The values are plotted only for those cells in which rewarming of area 21a resulted in a significant recovery of the responses to pre-cooling levels. Note that in all but one cell the magnitude of response to visual stimuli was increased after rewarming of area 21a (P < 0.0001; Mann–Whitney U test). The exception was a cell that increased its responses when area 21a was cooled. Not det, not determined.
