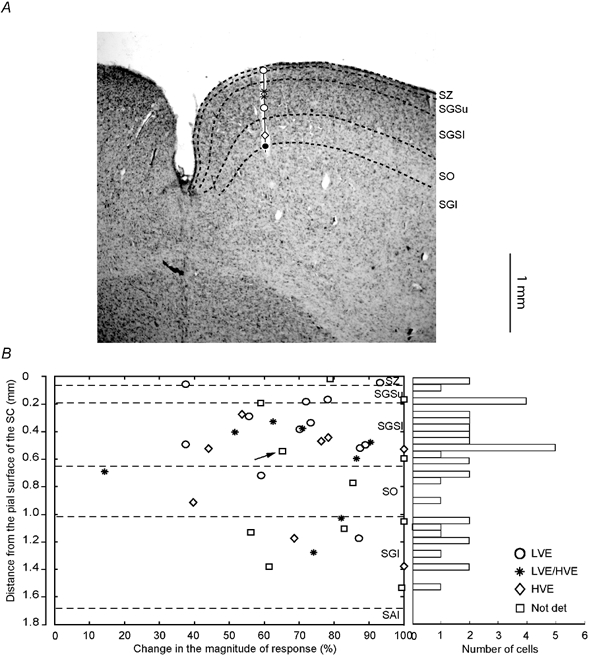
Figure 4. Laminar location of collicular neurones and changes in the magnitude of responses during reversible inactivation of area 21a.

A, reconstruction of an electrode penetration through the superior colliculus. Laminar boundaries are indicated by black interrupted lines. Type and location of collicular cells are indicated by appropriate symbols (see lower right corner in B). Large black dot at the end of the track indicates the location of electrolytic lesion. B, changes in the magnitude of response during cooling area 21a vs. distance from the pial surface of the SC cells. Right, frequency histogram indicating the number of cells encountered in each lamina. Only cells which exhibited significant change in their magnitude of response during cooling are indicated. Note that in almost all the cells (38/39; 97 % of sample) the change was 38 % or more and that there is no correlation between the degree of change in the magnitude of response and the laminar position of the cell. Not det, not determined.
