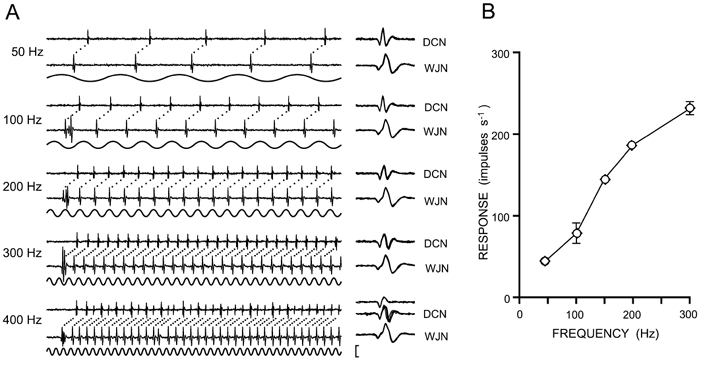
Figure 3. Impulse traces and stimulus-response relations for a single wrist joint afferent fibre recorded at both peripheral (WJN) and central (DCN) sites.

Vibratory stimuli were applied within the fibre's receptive field at a range of frequencies (50–400 Hz). A, each paired impulse trace shows the response to the first 100 ms of a 1 s stimulus, at a vibration amplitude that produced 1:1 following in the fibre (i.e. one impulse on every vibration cycle). Ten expanded, superimposed spike waveforms (1 ms long) are shown to the right in A. In response to the 400 Hz stimulus, the spike waveform recorded centrally began to switch between two alternative configurations, suggesting (in the approximately two-thirds of cases in the illustrated traces) that there is propagation block in either the entire terminal axon, or in one axonal branch at this high impulse frequency. B, response levels (impulses s−1 ± S.D.) at the central (diamonds) and peripheral (circles) segments of the same wrist joint afferent fibre plotted as a function of vibration frequency, when 1 s vibration trains were applied to the joint capsule at amplitudes that produced near 1:1 following in the fibre. However, at vibration frequencies of 100 and 300 Hz, the vibration amplitude was below that needed to generate a consistent 1:1 pattern of response and this contributes to the greater standard deviation seen in the response levels (for other vibration frequencies, the very low S.D. values fell within the symbols on the graph). The vertical scale bar represents 400 μV for WJN traces and 100 μV for DCN traces.
