
Figure 3. Effects of NAD and NADP on wild-type and mutant KATP channels.
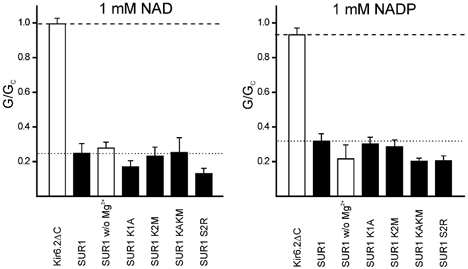
Mean macroscopic slope conductance (G) in the presence of either 1 mM NAD (left) or 1 mM NADP (right) expressed as a fraction of the mean of that measured in nucleotide-free solution before and after nucleotide application (Gc), for Kir6.2ΔC, and for Kir6.2 co-expressed with wild-type or mutant SUR1, as indicated. The dashed and dotted lines indicate the extent of inhibition of Kir6.2ΔC and Kir6.2/SUR1, respectively. Open bars, Mg2+-free solution; filled bars: Mg2+-containing solution.