
Figure 12. Establishment of a dose–response curve for the HCO3−–Cl− transport inhibitor DIDS.
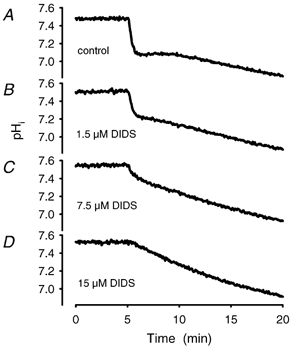
A dose–response curve has been derived from acidification experiments in the presence of various concentrations of DIDS. The time course of acidification was registered after incubation with DIDS for 10 min. A, control with vehicle (PBS) added. B, time course at 1.5 μM DIDS. C, time course in the presence of 7.5 μM DIDS and D, at 15 μM DIDS. The IC50 calculated from the velocity constants was 5.6 ± 1.2 μM, n = 25.