
Figure 3. GABA-induced currents display ATP-dependent rundown.
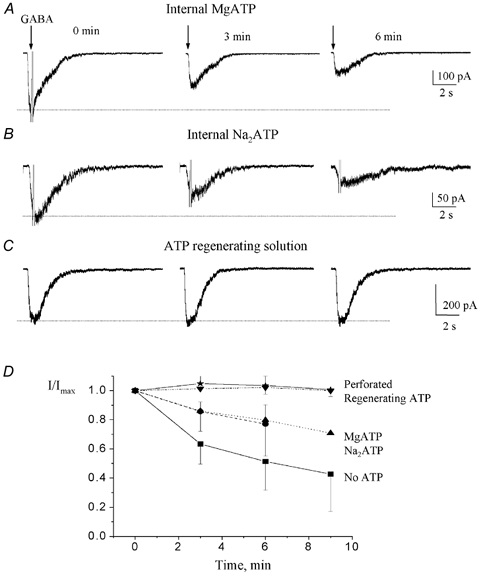
A-C, GABA-induced currents recorded at a holding potential of −70 mV. The internal solution contained either MgATP (A), Na2 ATP (B) or an ATP-regenerating solution (C). GABA was pressure applied at 100 μm every 3 min. D, mean (± s.e.m.) normalized GABA-induced current amplitudes plotted against the recording time for each internal solution containing: no ATP, ▪; MgATP, ▴; Na2ATP, •; a regenerating ATP solution, ▾; gramicidin (perforated), ⋆. GABA-induced current amplitudes were normalized to the peak current amplitude elicited by the first 100 μm GABA application.