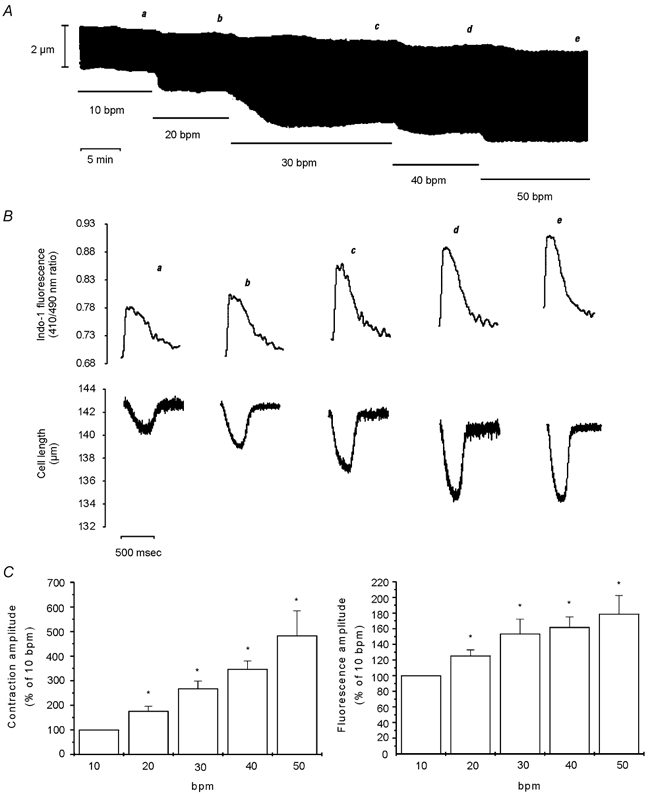
Figure 1. Effect of increasing stimulation frequency on myocyte contraction and CaiT.

A, a typical continuous recording of cell length at the stimulation frequencies indicated in the figure (bpm, beats min−1). B, traces of the individual twitch contractions and the associated indo-1 fluorescence transients at the moment indicated by the letters a-e on A. The traces show, from a to e, a gradual increase in diastolic [Ca2+]i, rate of CaiT decline and rate of twitch relaxation, and reduction in diastolic cell length. C, bar graphs depicting the overall results of the effect of increasing stimulation frequency on myocyte contraction amplitude and indo-1 transient amplitude, expressed as a percentage of the value at 10 bpm. Data are means ± s.e.m. of 8 cells, * P < 0.05 with respect to 10 bpm. Increasing stimulation frequency from 10 to 50 bpm resulted in parallel increases in contraction and CaiT amplitude.
