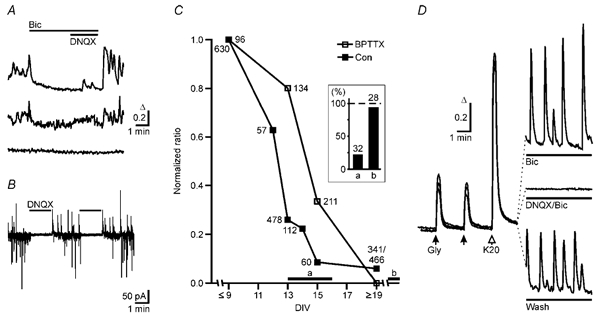
Figure 3. Chronic blockade of GABAA receptors does not prevent the developmental change of the GABA response.

A, spontaneous GABAA receptor-mediated calcium transients in developing neurons at DIV 8. The majority of neurons exhibited no spontaneous Ca2+ transients (bottom trace), but some neurons showed bicuculline-sensitive (top trace) Ca2+ signals. In addition we observed signals that were neither bicuculline nor DNQX sensitive. B, spontaneous synaptic currents in developing neurons (DIV 7) recorded at a holding potential (VH) at which spontaneous IPSCs and EPSCs were outward and inward currents, respectively. Application of the AMPA receptor blocker DNQX reversibly abolished all synaptic activity indicating that at this developmental stage most GABAergic neurons were not spontaneously active in the absence of an excitatory drive. C, time course of the GABA/glycine responses in control cultures (Con) and in cultures chronically treated (BPTTX: 20 μm bicuculline, 20 μm picrotoxin, 0.3 μm TTX). GABA/glycine-evoked Ca2+ signals were divided by the mean 20 mm KCl-induced Ca2+ signal (control 590 ± 8, n = 40, 1678 cells; BPTTX 1322 ± 16, n = 11, 907 cells). Before DIV 9, responses remained largely unchanged in control. Therefore ratios were normalized to the value at DIV ≤ 9 and plotted against the age of culture (n = 1–12 cultures, 51 in total). Inset shows that the relative abundance of neurons (columns a and b) with K+–Cl− cotransport activity increases in parallel with time in culture as revealed by patch-clamp recording (Kelsch et al. 2001). Times during which neurons with and without transport activity were sampled are indicated by the horizontal bars a and b in the plot of the GABA/glycine responses. The number of cells is indicated for each point in the plot and the columns in the inset. D, average Ca2+ signals induced by glycine and KCl and by spontaneous activity in three BPTTX-treated cultures at DIV 10. Left panel, responses from three different cultures to glycine (0.5 mm) and KCl (20 mm) in the presence of bicuculline, DNQX and TTX. Under these conditions no spontaneous calcium transients could be observed (right, middle trace, average of 135 cells). Neurons displayed spontaneous synchronized Ca2+ oscillations upon removal of antagonists (right, bottom trace, average of 79 cells). These oscillations were enhanced in the presence of bicuculline (right, top trace, average of 79 cells).
